

EULER (1707–83) as a device to analyze ARGUMENTs, it
was not until the publication of Venn’s 1881 book
Symbolic Logic that the practice of using such diagrams became common. Today these diagrams are
named in his honor.
Venn graduated from Gonville and Caius College,
Cambridge, in 1857 after studying theology and the
liberal arts. After working as an ordained priest for
several years, Venn returned to the same institution in
1862 to accept a position as a lecturer in moral science.
During this time he pursued interests in logic and PROBABILITY theory, and developed a “frequency theory” of
probability, which he published in 1866 in his Logic of
Chance. This work greatly influenced the development
of the theory of statistics. Fifteen years later Venn published Symbolic Logic, which he followed with The
Principles of Empirical Logic in 1889. Venn was
elected a fellow of the ROYAL SOCIETY in 1883.
After the publication of his work on logic, Venn
changed interests and took to researching and writing a
comprehensive account of the history of Gonville and
Caius College. This was an all-consuming task, and
only one volume of the work was published before his
death, April 4, 1923.
Venn diagrams have had a profound effect on
modern mathematics education. They are often used as
a device for encouraging logical thinking at the early
stage of a child’s intellectual development and are a
standard feature in an elementary-school curriculum.
See also VENN DIAGRAM.
Venn diagram A diagram in which mathematical
sets are represented by overlapping circles within a
boundary representing the universal set is called a Venn
diagram. Such diagrams provide convenient pictorial
representations of relations between sets. For example,
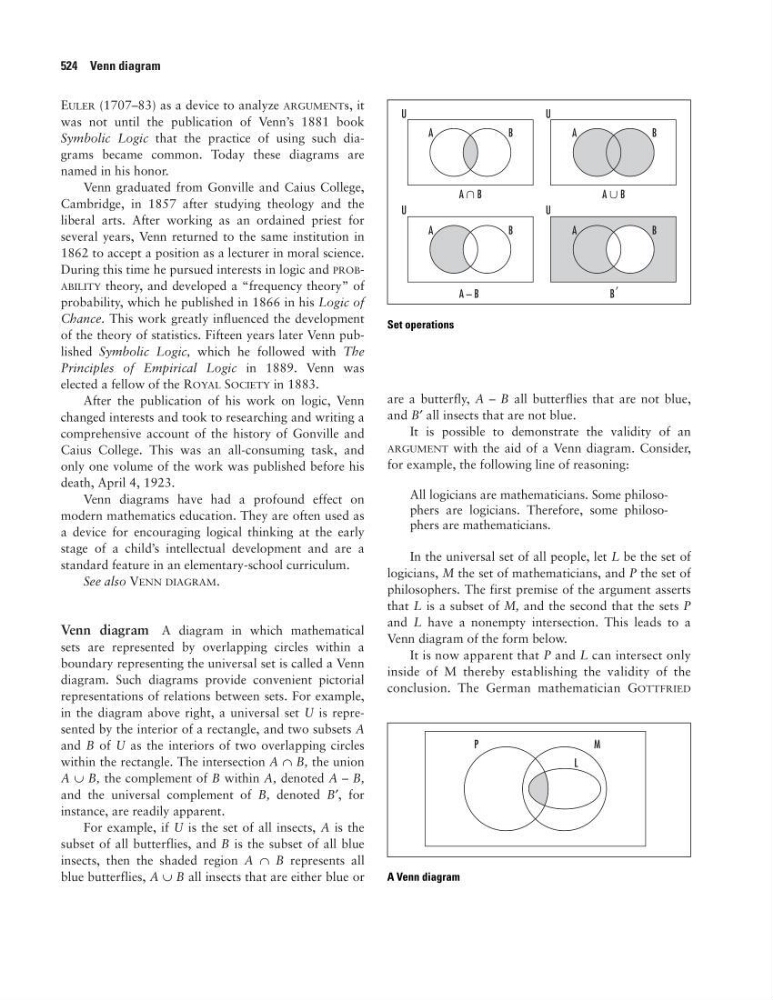
in the diagram above right, a universal set U is represented by the interior of a rectangle, and two subsets A
and B of U as the interiors of two overlapping circles
within the rectangle. The intersection A ∩ B, the union
A ∪ B, the complement of B within A, denoted A – B,
and the universal complement of B, denoted B′, for
instance, are readily apparent.
For example, if U is the set of all insects, A is the
subset of all butterflies, and B is the subset of all blue
insects, then the shaded region A ∩ B represents all
blue butterflies, A ∪ B all insects that are either blue or
are a butterfly, A – B all butterflies that are not blue,
and B′ all insects that are not blue.
It is possible to demonstrate the validity of an
ARGUMENT with the aid of a Venn diagram. Consider,
for example, the following line of reasoning:
All logicians are mathematicians. Some philosophers are logicians. Therefore, some philosophers are mathematicians.
In the universal set of all people, let L be the set of
logicians, M the set of mathematicians, and P the set of
philosophers. The first premise of the argument asserts
that L is a subset of M, and the second that the sets P
and L have a nonempty intersection. This leads to a
Venn diagram of the form below.
It is now apparent that P and L can intersect only
inside of M thereby establishing the validity of the
conclusion. The German mathematician GOTTFRIED
524 Venn diagram
Set operations
A Venn diagram
was not until the publication of Venn’s 1881 book
Symbolic Logic that the practice of using such diagrams became common. Today these diagrams are
named in his honor.
Venn graduated from Gonville and Caius College,
Cambridge, in 1857 after studying theology and the
liberal arts. After working as an ordained priest for
several years, Venn returned to the same institution in
1862 to accept a position as a lecturer in moral science.
During this time he pursued interests in logic and PROBABILITY theory, and developed a “frequency theory” of
probability, which he published in 1866 in his Logic of
Chance. This work greatly influenced the development
of the theory of statistics. Fifteen years later Venn published Symbolic Logic, which he followed with The
Principles of Empirical Logic in 1889. Venn was
elected a fellow of the ROYAL SOCIETY in 1883.
After the publication of his work on logic, Venn
changed interests and took to researching and writing a
comprehensive account of the history of Gonville and
Caius College. This was an all-consuming task, and
only one volume of the work was published before his
death, April 4, 1923.
Venn diagrams have had a profound effect on
modern mathematics education. They are often used as
a device for encouraging logical thinking at the early
stage of a child’s intellectual development and are a
standard feature in an elementary-school curriculum.
See also VENN DIAGRAM.
Venn diagram A diagram in which mathematical
sets are represented by overlapping circles within a
boundary representing the universal set is called a Venn
diagram. Such diagrams provide convenient pictorial
representations of relations between sets. For example,
in the diagram above right, a universal set U is represented by the interior of a rectangle, and two subsets A
and B of U as the interiors of two overlapping circles
within the rectangle. The intersection A ∩ B, the union
A ∪ B, the complement of B within A, denoted A – B,
and the universal complement of B, denoted B′, for
instance, are readily apparent.
For example, if U is the set of all insects, A is the
subset of all butterflies, and B is the subset of all blue
insects, then the shaded region A ∩ B represents all
blue butterflies, A ∪ B all insects that are either blue or
are a butterfly, A – B all butterflies that are not blue,
and B′ all insects that are not blue.
It is possible to demonstrate the validity of an
ARGUMENT with the aid of a Venn diagram. Consider,
for example, the following line of reasoning:
All logicians are mathematicians. Some philosophers are logicians. Therefore, some philosophers are mathematicians.
In the universal set of all people, let L be the set of
logicians, M the set of mathematicians, and P the set of
philosophers. The first premise of the argument asserts
that L is a subset of M, and the second that the sets P
and L have a nonempty intersection. This leads to a
Venn diagram of the form below.
It is now apparent that P and L can intersect only
inside of M thereby establishing the validity of the
conclusion. The German mathematician GOTTFRIED
524 Venn diagram
Set operations
A Venn diagram