

Soderi, Mucchi, Hämäläinen, Piva, and Iinatti
128
6.2.4 Secrecy Capacity of WBPLSec
Win et al. [16] utilized a general wireless propagation model to characterize network
interference in wireless systems. In accordance with that model, the received power,
that is P rx , is P
d
tx
n
b
2 , where P tx denotes the transmitted power, d n , the distance between
the two nodes and b is the amplitude loss exponent [10].
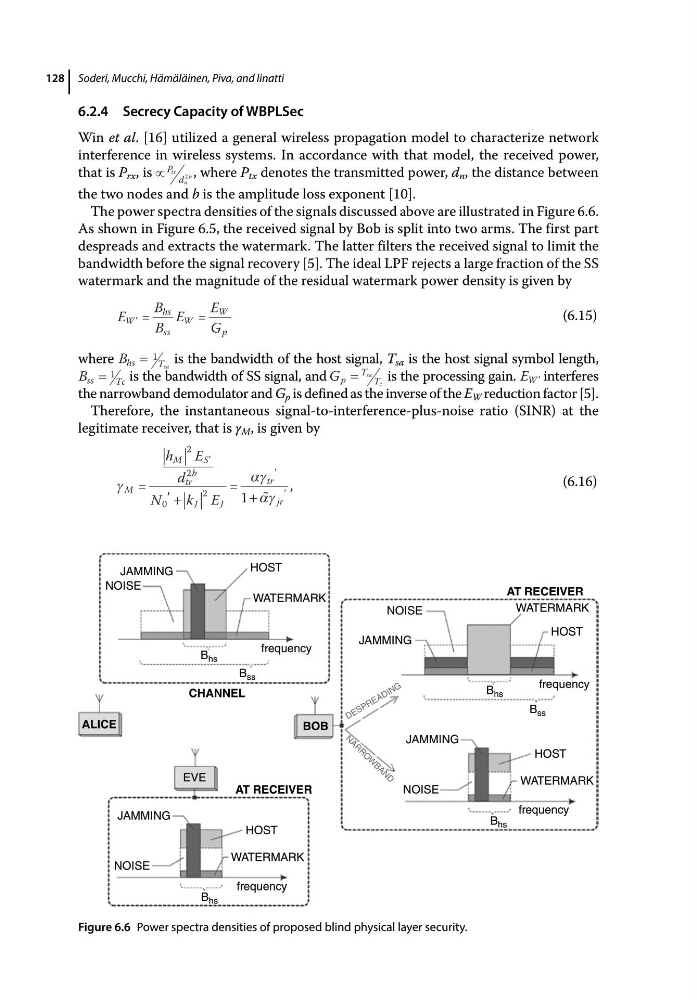
The power spectra densities of the signals discussed above are illustrated in Figure 6.6.
As shown in Figure 6.5, the received signal by Bob is split into two arms. The first part
despreads and extracts the watermark. The latter filters the received signal to limit the
bandwidth before the signal recovery [5]. The ideal LPF rejects a large fraction of the SS
watermark and the magnitude of the residual watermark power density is given by
E
B
B
E
E
G
W
hs
ss
W
W
p
=
=
(6.15)
where B hs
T sa
1
is the bandwidth of the host signal, T sa is the host signal symbol length,
B ss Tc
1 is the bandwidth of SS signal, and G p
T T
sa
c
is the processing gain. E W interferes
the narrowband demodulator and G p is defined as the inverse of the E W reduction factor [5].
Therefore, the instantaneous signal‐to‐interference‐plus‐noise ratio (SINR) at the
legitimate receiver, that is γ M , is given by
M
M
S
tr
b
J
J
tr
jr
h
E
d
N
k E
=
= 1
,
2
2
0
2
(6.16)
JAMMING
NOISE
HOST
WATERMARK
frequency
frequency
frequency
N A R R O
W B A N D
D E S P R E A D IN
G
B ss
B ss
B hs
B hs
CHANNEL
ALICE
BOB
EVE
AT RECEIVER
HOST
WATERMARK
WATERMARK
WATERMARK
JAMMING
JAMMING
NOISE
HOST
HOST
NOISE
AT RECEIVER
NOISE
JAMMING
frequency
B hs
B hs
Figure 6.6 Power spectra densities of proposed blind physical layer security.
128
6.2.4 Secrecy Capacity of WBPLSec
Win et al. [16] utilized a general wireless propagation model to characterize network
interference in wireless systems. In accordance with that model, the received power,
that is P rx , is P
d
tx
n
b
2 , where P tx denotes the transmitted power, d n , the distance between
the two nodes and b is the amplitude loss exponent [10].
The power spectra densities of the signals discussed above are illustrated in Figure 6.6.
As shown in Figure 6.5, the received signal by Bob is split into two arms. The first part
despreads and extracts the watermark. The latter filters the received signal to limit the
bandwidth before the signal recovery [5]. The ideal LPF rejects a large fraction of the SS
watermark and the magnitude of the residual watermark power density is given by
E
B
B
E
E
G
W
hs
ss
W
W
p
=
=
(6.15)
where B hs
T sa
1
is the bandwidth of the host signal, T sa is the host signal symbol length,
B ss Tc
1 is the bandwidth of SS signal, and G p
T T
sa
c
is the processing gain. E W interferes
the narrowband demodulator and G p is defined as the inverse of the E W reduction factor [5].
Therefore, the instantaneous signal‐to‐interference‐plus‐noise ratio (SINR) at the
legitimate receiver, that is γ M , is given by
M
M
S
tr
b
J
J
tr
jr
h
E
d
N
k E
=
= 1
,
2
2
0
2
(6.16)
JAMMING
NOISE
HOST
WATERMARK
frequency
frequency
frequency
N A R R O
W B A N D
D E S P R E A D IN
G
B ss
B ss
B hs
B hs
CHANNEL
ALICE
BOB
EVE
AT RECEIVER
HOST
WATERMARK
WATERMARK
WATERMARK
JAMMING
JAMMING
NOISE
HOST
HOST
NOISE
AT RECEIVER
NOISE
JAMMING
frequency
B hs
B hs
Figure 6.6 Power spectra densities of proposed blind physical layer security.