

80
C. Elizabeth Rani et al.
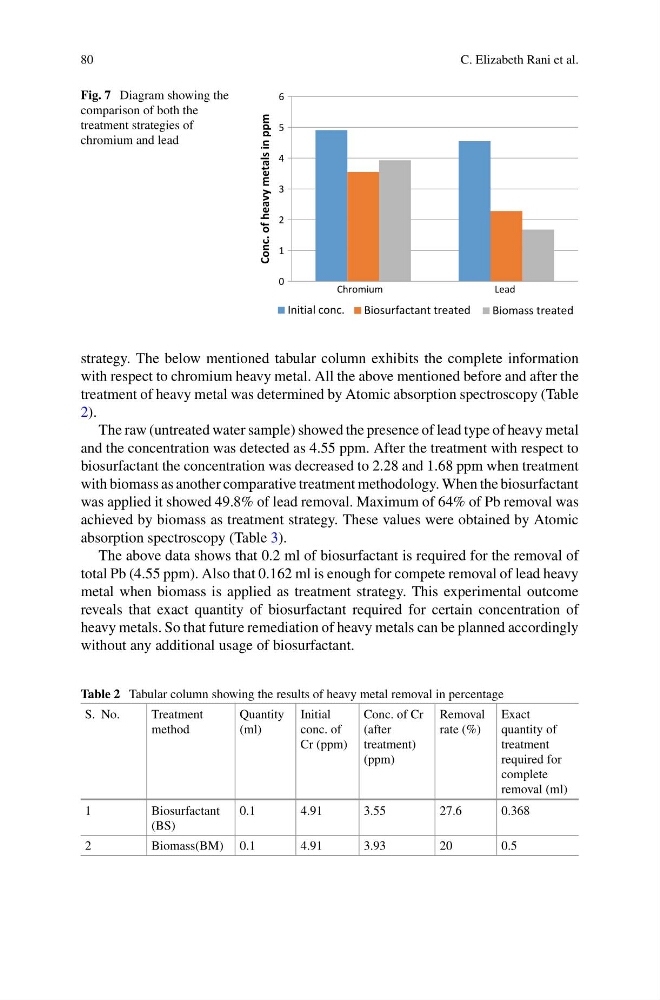
Fig. 7 Diagram showing the
comparison of both the
treatment strategies of
chromium and lead
0
1
2
3
4
5
6
Chromium
Lead
Conc. of heavy metals in ppm
Initial conc.
Biosurfactant treated
Biomass treated
strategy. The below mentioned tabular column exhibits the complete information
with respect to chromium heavy metal. All the above mentioned before and after the
treatment of heavy metal was determined by Atomic absorption spectroscopy (Table
2).
The raw (untreated water sample) showed the presence of lead type of heavy metal
and the concentration was detected as 4.55 ppm. After the treatment with respect to
biosurfactant the concentration was decreased to 2.28 and 1.68 ppm when treatment
with biomass as another comparative treatment methodology. When the biosurfactant
was applied it showed 49.8% of lead removal. Maximum of 64% of Pb removal was
achieved by biomass as treatment strategy. These values were obtained by Atomic
absorption spectroscopy (Table 3).
The above data shows that 0.2 ml of biosurfactant is required for the removal of
total Pb (4.55 ppm). Also that 0.162 ml is enough for compete removal of lead heavy
metal when biomass is applied as treatment strategy. This experimental outcome
reveals that exact quantity of biosurfactant required for certain concentration of
heavy metals. So that future remediation of heavy metals can be planned accordingly
without any additional usage of biosurfactant.
Table 2 Tabular column showing the results of heavy metal removal in percentage
S. No.
Treatment
method
Quantity
(ml)
Initial
conc. of
Cr (ppm)
Conc. of Cr
(after
treatment)
(ppm)
Removal
rate (%)
Exact
quantity of
treatment
required for
complete
removal (ml)
1
Biosurfactant
(BS)
0.1
4.91
3.55
27.6
0.368
2
Biomass(BM) 0.1
4.91
3.93
20
0.5
C. Elizabeth Rani et al.
Fig. 7 Diagram showing the
comparison of both the
treatment strategies of
chromium and lead
0
1
2
3
4
5
6
Chromium
Lead
Conc. of heavy metals in ppm
Initial conc.
Biosurfactant treated
Biomass treated
strategy. The below mentioned tabular column exhibits the complete information
with respect to chromium heavy metal. All the above mentioned before and after the
treatment of heavy metal was determined by Atomic absorption spectroscopy (Table
2).
The raw (untreated water sample) showed the presence of lead type of heavy metal
and the concentration was detected as 4.55 ppm. After the treatment with respect to
biosurfactant the concentration was decreased to 2.28 and 1.68 ppm when treatment
with biomass as another comparative treatment methodology. When the biosurfactant
was applied it showed 49.8% of lead removal. Maximum of 64% of Pb removal was
achieved by biomass as treatment strategy. These values were obtained by Atomic
absorption spectroscopy (Table 3).
The above data shows that 0.2 ml of biosurfactant is required for the removal of
total Pb (4.55 ppm). Also that 0.162 ml is enough for compete removal of lead heavy
metal when biomass is applied as treatment strategy. This experimental outcome
reveals that exact quantity of biosurfactant required for certain concentration of
heavy metals. So that future remediation of heavy metals can be planned accordingly
without any additional usage of biosurfactant.
Table 2 Tabular column showing the results of heavy metal removal in percentage
S. No.
Treatment
method
Quantity
(ml)
Initial
conc. of
Cr (ppm)
Conc. of Cr
(after
treatment)
(ppm)
Removal
rate (%)
Exact
quantity of
treatment
required for
complete
removal (ml)
1
Biosurfactant
(BS)
0.1
4.91
3.55
27.6
0.368
2
Biomass(BM) 0.1
4.91
3.93
20
0.5