

62
V. Anitha et al.
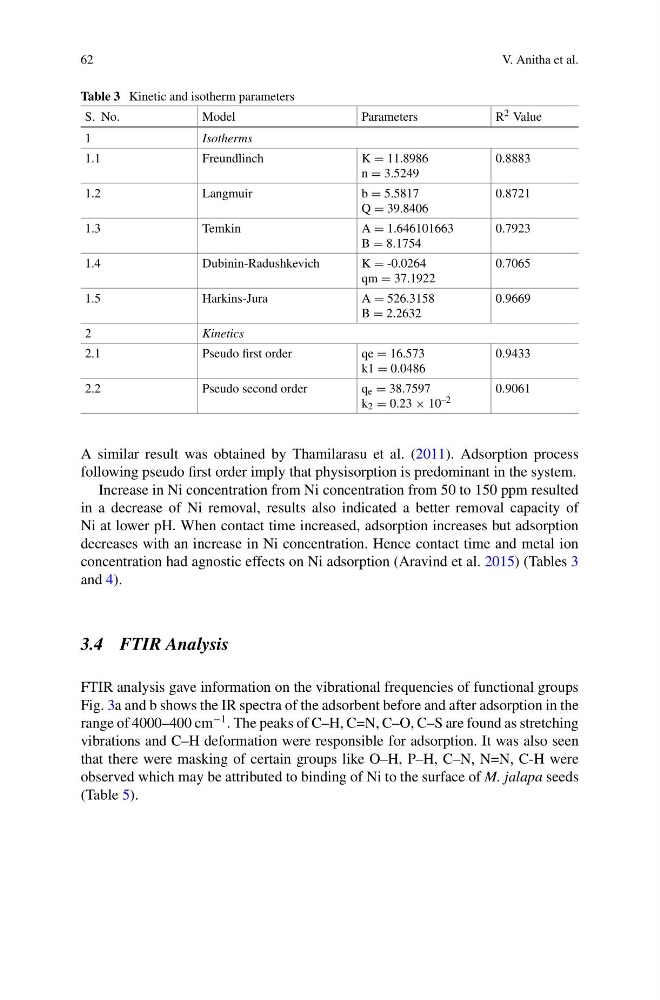
Table 3 Kinetic and isotherm parameters
S. No.
Model
Parameters
R 2 Value
1
Isotherms
1.1
Freundlinch
K = 11.8986
n = 3.5249
0.8883
1.2
Langmuir
b = 5.5817
Q = 39.8406
0.8721
1.3
Temkin
A = 1.646101663
B = 8.1754
0.7923
1.4
Dubinin-Radushkevich
K = -0.0264
qm = 37.1922
0.7065
1.5
Harkins-Jura
A = 526.3158
B = 2.2632
0.9669
2
Kinetics
2.1
Pseudo first order
qe = 16.573
k1 = 0.0486
0.9433
2.2
Pseudo second order
q e = 38.7597
k 2 = 0.23 × 10 –2
0.9061
A similar result was obtained by Thamilarasu et al. (2011). Adsorption process
following pseudo first order imply that physisorption is predominant in the system.
Increase in Ni concentration from Ni concentration from 50 to 150 ppm resulted
in a decrease of Ni removal, results also indicated a better removal capacity of
Ni at lower pH. When contact time increased, adsorption increases but adsorption
decreases with an increase in Ni concentration. Hence contact time and metal ion
concentration had agnostic effects on Ni adsorption (Aravind et al. 2015) (Tables 3
and 4).
3.4 FTIR Analysis
FTIR analysis gave information on the vibrational frequencies of functional groups
Fig. 3a and b shows the IR spectra of the adsorbent before and after adsorption in the
range of 4000–400 cm
−1 . The peaks of C–H, C=N, C–O, C–S are found as stretching
vibrations and C–H deformation were responsible for adsorption. It was also seen
that there were masking of certain groups like O–H, P–H, C–N, N=N, C-H were
observed which may be attributed to binding of Ni to the surface of M. jalapa seeds
(Table 5).
V. Anitha et al.
Table 3 Kinetic and isotherm parameters
S. No.
Model
Parameters
R 2 Value
1
Isotherms
1.1
Freundlinch
K = 11.8986
n = 3.5249
0.8883
1.2
Langmuir
b = 5.5817
Q = 39.8406
0.8721
1.3
Temkin
A = 1.646101663
B = 8.1754
0.7923
1.4
Dubinin-Radushkevich
K = -0.0264
qm = 37.1922
0.7065
1.5
Harkins-Jura
A = 526.3158
B = 2.2632
0.9669
2
Kinetics
2.1
Pseudo first order
qe = 16.573
k1 = 0.0486
0.9433
2.2
Pseudo second order
q e = 38.7597
k 2 = 0.23 × 10 –2
0.9061
A similar result was obtained by Thamilarasu et al. (2011). Adsorption process
following pseudo first order imply that physisorption is predominant in the system.
Increase in Ni concentration from Ni concentration from 50 to 150 ppm resulted
in a decrease of Ni removal, results also indicated a better removal capacity of
Ni at lower pH. When contact time increased, adsorption increases but adsorption
decreases with an increase in Ni concentration. Hence contact time and metal ion
concentration had agnostic effects on Ni adsorption (Aravind et al. 2015) (Tables 3
and 4).
3.4 FTIR Analysis
FTIR analysis gave information on the vibrational frequencies of functional groups
Fig. 3a and b shows the IR spectra of the adsorbent before and after adsorption in the
range of 4000–400 cm
−1 . The peaks of C–H, C=N, C–O, C–S are found as stretching
vibrations and C–H deformation were responsible for adsorption. It was also seen
that there were masking of certain groups like O–H, P–H, C–N, N=N, C-H were
observed which may be attributed to binding of Ni to the surface of M. jalapa seeds
(Table 5).