

44
A. Arivoli et al.
4 Results
This study was taken up to assess the quality of groundwater of different sources in the
surrounding areas of Cuddalore district, Tamil Nadu, India. The physico-chemical
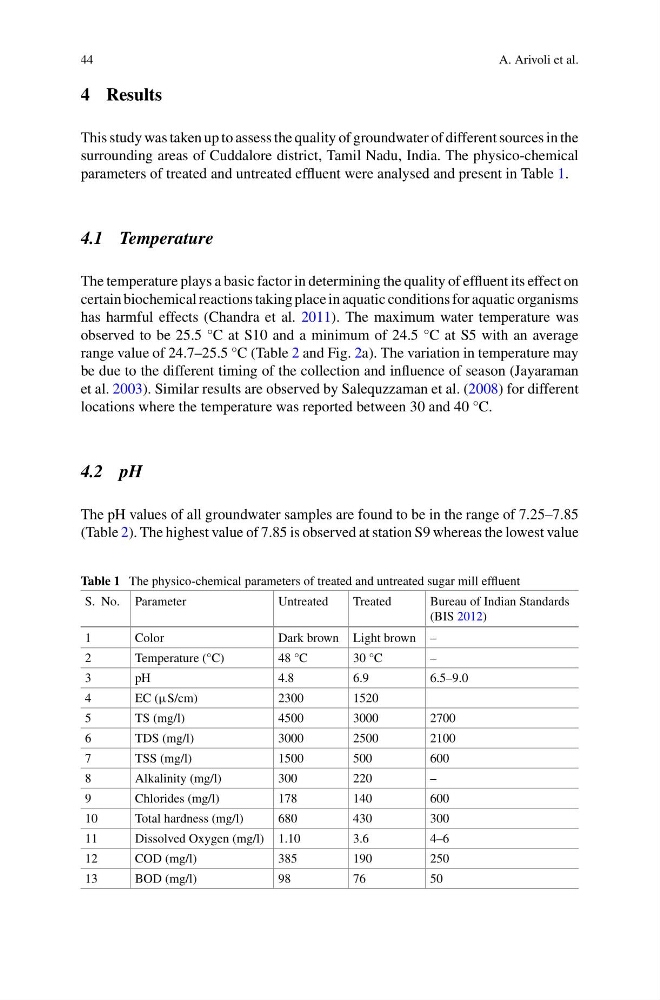
parameters of treated and untreated effluent were analysed and present in Table 1.
4.1 Temperature
The temperature plays a basic factor in determining the quality of effluent its effect on
certain biochemical reactions taking place in aquatic conditions for aquatic organisms
has harmful effects (Chandra et al. 2011). The maximum water temperature was
observed to be 25.5 °C at S10 and a minimum of 24.5 °C at S5 with an average
range value of 24.7–25.5 °C (Table 2 and Fig. 2a). The variation in temperature may
be due to the different timing of the collection and influence of season (Jayaraman
et al. 2003). Similar results are observed by Salequzzaman et al. (2008) for different
locations where the temperature was reported between 30 and 40 °C.
4.2 pH
The pH values of all groundwater samples are found to be in the range of 7.25–7.85
(Table 2). The highest value of 7.85 is observed at station S9 whereas the lowest value
Table 1 The physico-chemical parameters of treated and untreated sugar mill effluent
S. No. Parameter
Untreated
Treated
Bureau of Indian Standards
(BIS 2012)
1
Color
Dark brown Light brown –
2
Temperature (°C)
48 °C
30 °C
–
3
pH
4.8
6.9
6.5–9.0
4
EC (µS/cm)
2300
1520
5
TS (mg/l)
4500
3000
2700
6
TDS (mg/l)
3000
2500
2100
7
TSS (mg/l)
1500
500
600
8
Alkalinity (mg/l)
300
220
–
9
Chlorides (mg/l)
178
140
600
10
Total hardness (mg/l)
680
430
300
11
Dissolved Oxygen (mg/l) 1.10
3.6
4–6
12
COD (mg/l)
385
190
250
13
BOD (mg/l)
98
76
50
A. Arivoli et al.
4 Results
This study was taken up to assess the quality of groundwater of different sources in the
surrounding areas of Cuddalore district, Tamil Nadu, India. The physico-chemical
parameters of treated and untreated effluent were analysed and present in Table 1.
4.1 Temperature
The temperature plays a basic factor in determining the quality of effluent its effect on
certain biochemical reactions taking place in aquatic conditions for aquatic organisms
has harmful effects (Chandra et al. 2011). The maximum water temperature was
observed to be 25.5 °C at S10 and a minimum of 24.5 °C at S5 with an average
range value of 24.7–25.5 °C (Table 2 and Fig. 2a). The variation in temperature may
be due to the different timing of the collection and influence of season (Jayaraman
et al. 2003). Similar results are observed by Salequzzaman et al. (2008) for different
locations where the temperature was reported between 30 and 40 °C.
4.2 pH
The pH values of all groundwater samples are found to be in the range of 7.25–7.85
(Table 2). The highest value of 7.85 is observed at station S9 whereas the lowest value
Table 1 The physico-chemical parameters of treated and untreated sugar mill effluent
S. No. Parameter
Untreated
Treated
Bureau of Indian Standards
(BIS 2012)
1
Color
Dark brown Light brown –
2
Temperature (°C)
48 °C
30 °C
–
3
pH
4.8
6.9
6.5–9.0
4
EC (µS/cm)
2300
1520
5
TS (mg/l)
4500
3000
2700
6
TDS (mg/l)
3000
2500
2100
7
TSS (mg/l)
1500
500
600
8
Alkalinity (mg/l)
300
220
–
9
Chlorides (mg/l)
178
140
600
10
Total hardness (mg/l)
680
430
300
11
Dissolved Oxygen (mg/l) 1.10
3.6
4–6
12
COD (mg/l)
385
190
250
13
BOD (mg/l)
98
76
50