

40
elements, the data were normalized by using Li as normaliser element (Loring and
Rantala 1992). The method was also used by Bekteshi et al. (2015) to 2010 moss
survey concentration data of Albania.
The relationship between the elements in moss was tested by Spearman correlation analysis, confirmed by the statistical significance level, P < 0.01. Factor analysis (FA) was applied as an extension of the correlation analysis to assess the
relationship between elements present in moss samples and to identify the most
important factors that probably affect the association of the elements in the same
factor. FA may explore the hidden multivariate structures of the data (Astel et al.
2008; Reimann et al. 2002) and may clarify the link between the elements that tend
to have similar origins or to subsequently develop similar associations on the data
matrix. Each factor was explained on the basis of the associations of the elements
extracted from the correlation matrix. The statistical analysis was performed using
the Minitab 17 software package. ArcGIS 10.2 in combination with local deterministic methods and the inverse distance weighting were used for mapping the spatial
distribution of the elements.
2.2.6 Health Risk Assessment
The concentration data of the most toxic elements (As, Cd, Hg and Pb) are used to
calculate the chronic daily intake dose (CDI) of vegetables intake by using the formula given by EPA regulations (EPA 1989, 2001):
CDI
IR ED EF
BW AT
ing =
∗ ∗
∗
∗
∗
−
C
10
6
(2.1)
where:
CDI ing – chronic daily intake dose caused by metal content in edible vegetables
(100 mg)
C – metal contents in specific sites (mg kg
−1
) (in mosses in this case)
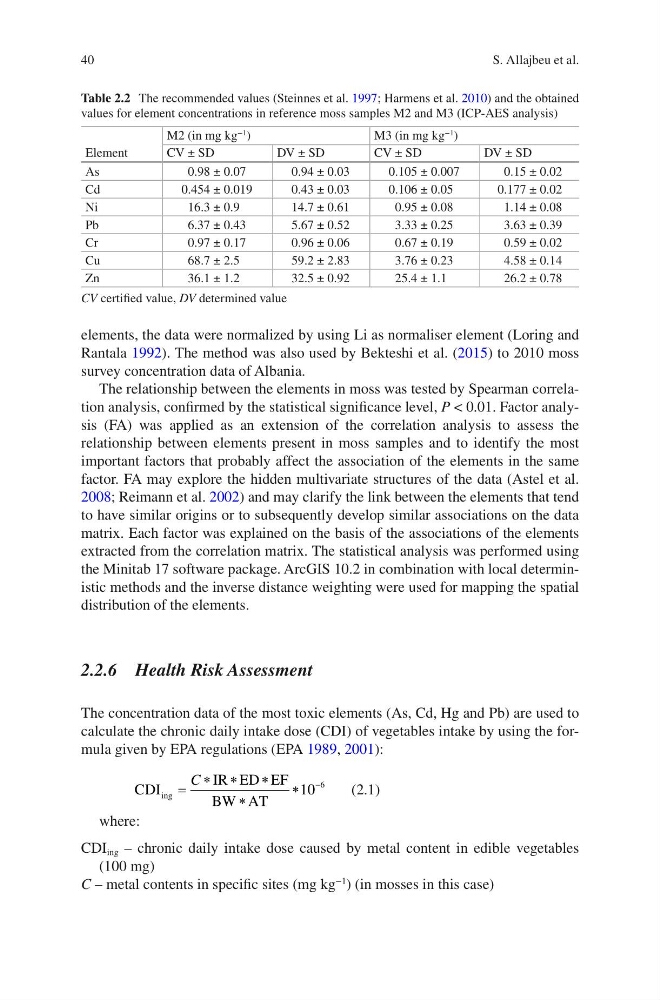
Table 2.2 The recommended values (Steinnes et al. 1997; Harmens et al. 2010) and the obtained
values for element concentrations in reference moss samples M2 and M3 (ICP-AES analysis)
Element
M2 (in mg kg
−1 )
M3 (in mg kg
−1
)
CV ± SD
DV ± SD
CV ± SD
DV ± SD
As
0.98 ± 0.07
0.94 ± 0.03
0.105 ± 0.007
0.15 ± 0.02
Cd
0.454 ± 0.019
0.43 ± 0.03
0.106 ± 0.05
0.177 ± 0.02
Ni
16.3 ± 0.9
14.7 ± 0.61
0.95 ± 0.08
1.14 ± 0.08
Pb
6.37 ± 0.43
5.67 ± 0.52
3.33 ± 0.25
3.63 ± 0.39
Cr
0.97 ± 0.17
0.96 ± 0.06
0.67 ± 0.19
0.59 ± 0.02
Cu
68.7 ± 2.5
59.2 ± 2.83
3.76 ± 0.23
4.58 ± 0.14
Zn
36.1 ± 1.2
32.5 ± 0.92
25.4 ± 1.1
26.2 ± 0.78
CV certified value, DV determined value
S. Allajbeu et al.
elements, the data were normalized by using Li as normaliser element (Loring and
Rantala 1992). The method was also used by Bekteshi et al. (2015) to 2010 moss
survey concentration data of Albania.
The relationship between the elements in moss was tested by Spearman correlation analysis, confirmed by the statistical significance level, P < 0.01. Factor analysis (FA) was applied as an extension of the correlation analysis to assess the
relationship between elements present in moss samples and to identify the most
important factors that probably affect the association of the elements in the same
factor. FA may explore the hidden multivariate structures of the data (Astel et al.
2008; Reimann et al. 2002) and may clarify the link between the elements that tend
to have similar origins or to subsequently develop similar associations on the data
matrix. Each factor was explained on the basis of the associations of the elements
extracted from the correlation matrix. The statistical analysis was performed using
the Minitab 17 software package. ArcGIS 10.2 in combination with local deterministic methods and the inverse distance weighting were used for mapping the spatial
distribution of the elements.
2.2.6 Health Risk Assessment
The concentration data of the most toxic elements (As, Cd, Hg and Pb) are used to
calculate the chronic daily intake dose (CDI) of vegetables intake by using the formula given by EPA regulations (EPA 1989, 2001):
CDI
IR ED EF
BW AT
ing =
∗ ∗
∗
∗
∗
−
C
10
6
(2.1)
where:
CDI ing – chronic daily intake dose caused by metal content in edible vegetables
(100 mg)
C – metal contents in specific sites (mg kg
−1
) (in mosses in this case)
Table 2.2 The recommended values (Steinnes et al. 1997; Harmens et al. 2010) and the obtained
values for element concentrations in reference moss samples M2 and M3 (ICP-AES analysis)
Element
M2 (in mg kg
−1 )
M3 (in mg kg
−1
)
CV ± SD
DV ± SD
CV ± SD
DV ± SD
As
0.98 ± 0.07
0.94 ± 0.03
0.105 ± 0.007
0.15 ± 0.02
Cd
0.454 ± 0.019
0.43 ± 0.03
0.106 ± 0.05
0.177 ± 0.02
Ni
16.3 ± 0.9
14.7 ± 0.61
0.95 ± 0.08
1.14 ± 0.08
Pb
6.37 ± 0.43
5.67 ± 0.52
3.33 ± 0.25
3.63 ± 0.39
Cr
0.97 ± 0.17
0.96 ± 0.06
0.67 ± 0.19
0.59 ± 0.02
Cu
68.7 ± 2.5
59.2 ± 2.83
3.76 ± 0.23
4.58 ± 0.14
Zn
36.1 ± 1.2
32.5 ± 0.92
25.4 ± 1.1
26.2 ± 0.78
CV certified value, DV determined value
S. Allajbeu et al.