

39
sample and 10 ml nitric acid 9:1 v/v in half pressure Teflon tubes) was applied for
Hg digestion as given by Lazo et al. (2018).
Three replicates per moss samples were digested, and three replicate measurements per digests were made during the analysis. The limits of the quantification
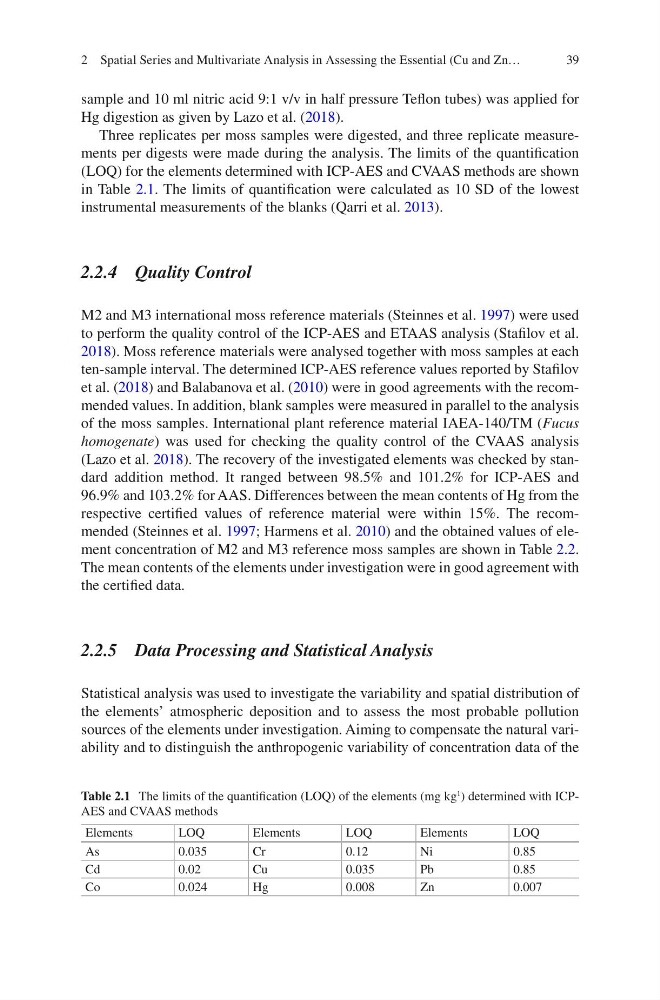
(LOQ) for the elements determined with ICP-AES and CVAAS methods are shown
in Table 2.1. The limits of quantification were calculated as 10 SD of the lowest
instrumental measurements of the blanks (Qarri et al. 2013).
2.2.4 Quality Control
M2 and M3 international moss reference materials (Steinnes et al. 1997) were used
to perform the quality control of the ICP-AES and ETAAS analysis (Stafilov et al.
2018). Moss reference materials were analysed together with moss samples at each
ten-sample interval. The determined ICP-AES reference values reported by Stafilov
et al. (2018) and Balabanova et al. (2010) were in good agreements with the recommended values. In addition, blank samples were measured in parallel to the analysis
of the moss samples. International plant reference material IAEA-140/TM (Fucus
homogenate) was used for checking the quality control of the CVAAS analysis
(Lazo et al. 2018). The recovery of the investigated elements was checked by standard addition method. It ranged between 98.5% and 101.2% for ICP-AES and
96.9% and 103.2% for AAS. Differences between the mean contents of Hg from the
respective certified values of reference material were within 15%. The recommended (Steinnes et al. 1997; Harmens et al. 2010) and the obtained values of element concentration of M2 and M3 reference moss samples are shown in Table 2.2.
The mean contents of the elements under investigation were in good agreement with
the certified data.
2.2.5 Data Processing and Statistical Analysis
Statistical analysis was used to investigate the variability and spatial distribution of
the elements’ atmospheric deposition and to assess the most probable pollution
sources of the elements under investigation. Aiming to compensate the natural variability and to distinguish the anthropogenic variability of concentration data of the
Table 2.1 The limits of the quantification (LOQ) of the elements (mg kg
1
) determined with ICPAES and CVAAS methods
Elements
LOQ
Elements
LOQ
Elements
LOQ
As
0.035
Cr
0.12
Ni
0.85
Cd
0.02
Cu
0.035
Pb
0.85
Co
0.024
Hg
0.008
Zn
0.007
2 Spatial Series and Multivariate Analysis in Assessing the Essential (Cu and Zn…
sample and 10 ml nitric acid 9:1 v/v in half pressure Teflon tubes) was applied for
Hg digestion as given by Lazo et al. (2018).
Three replicates per moss samples were digested, and three replicate measurements per digests were made during the analysis. The limits of the quantification
(LOQ) for the elements determined with ICP-AES and CVAAS methods are shown
in Table 2.1. The limits of quantification were calculated as 10 SD of the lowest
instrumental measurements of the blanks (Qarri et al. 2013).
2.2.4 Quality Control
M2 and M3 international moss reference materials (Steinnes et al. 1997) were used
to perform the quality control of the ICP-AES and ETAAS analysis (Stafilov et al.
2018). Moss reference materials were analysed together with moss samples at each
ten-sample interval. The determined ICP-AES reference values reported by Stafilov
et al. (2018) and Balabanova et al. (2010) were in good agreements with the recommended values. In addition, blank samples were measured in parallel to the analysis
of the moss samples. International plant reference material IAEA-140/TM (Fucus
homogenate) was used for checking the quality control of the CVAAS analysis
(Lazo et al. 2018). The recovery of the investigated elements was checked by standard addition method. It ranged between 98.5% and 101.2% for ICP-AES and
96.9% and 103.2% for AAS. Differences between the mean contents of Hg from the
respective certified values of reference material were within 15%. The recommended (Steinnes et al. 1997; Harmens et al. 2010) and the obtained values of element concentration of M2 and M3 reference moss samples are shown in Table 2.2.
The mean contents of the elements under investigation were in good agreement with
the certified data.
2.2.5 Data Processing and Statistical Analysis
Statistical analysis was used to investigate the variability and spatial distribution of
the elements’ atmospheric deposition and to assess the most probable pollution
sources of the elements under investigation. Aiming to compensate the natural variability and to distinguish the anthropogenic variability of concentration data of the
Table 2.1 The limits of the quantification (LOQ) of the elements (mg kg
1
) determined with ICPAES and CVAAS methods
Elements
LOQ
Elements
LOQ
Elements
LOQ
As
0.035
Cr
0.12
Ni
0.85
Cd
0.02
Cu
0.035
Pb
0.85
Co
0.024
Hg
0.008
Zn
0.007
2 Spatial Series and Multivariate Analysis in Assessing the Essential (Cu and Zn…