

41
IR – vegetable ingestion rate (100 g/day)
ED – exposure duration (24 year)
EF – exposure frequency (day/a) (365 day year
−1
)
BW – average body weight (70 kg for adults)
AT nc – average exposure time (365 × 24 day)
AT c – average exposure time (365 × 70 day)
LT – lifetime expected (70 year)
10
−6
– conversion factor (kg-mg)
The probability of cancer (c) risk as a result of exposure to the carcinogenic hazards was calculated according to Eq. (2.1) (EPA 2001). The carcinogenic risk (CR)
was estimated by the sum of the non-cancer (nc) and cancer (c) risk of each carcinogenic element (As, Cd, Hg and Pb). The CR < 1 × 10
−6
is considered as a carcinogenic target risk, and if the CR > 1 × 10
−4
, it is qualified as an unacceptable value
(Candeias et al. 2014).
2.3 Result and Discussion
2.3.1 Trace Metal Concentrations in Moss Samples
Only the most toxic elements that show negative health impact and environmental
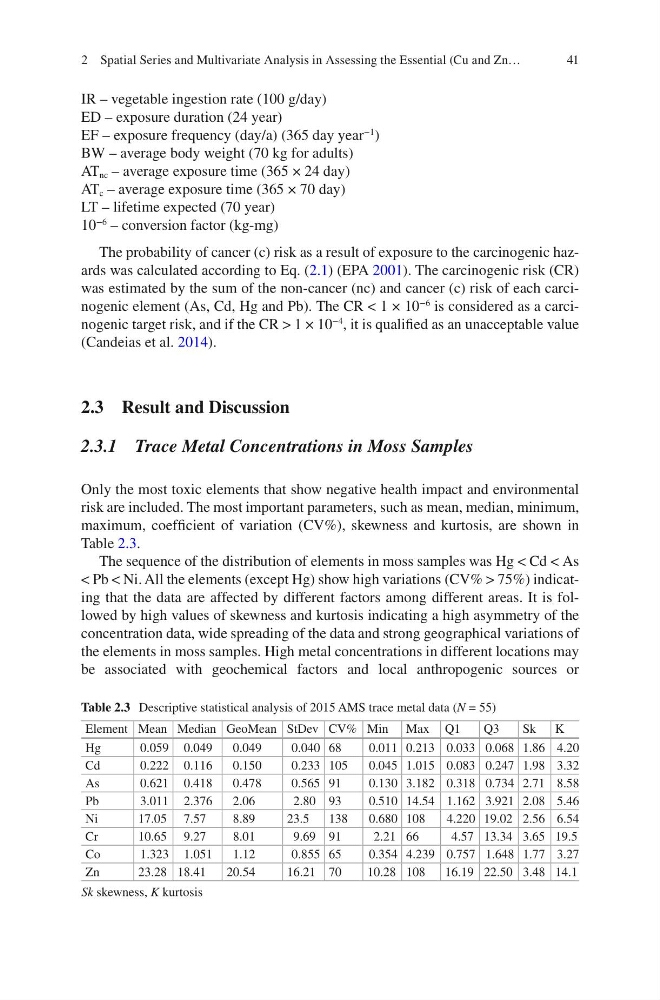
risk are included. The most important parameters, such as mean, median, minimum,
maximum, coefficient of variation (CV%), skewness and kurtosis, are shown in
Table 2.3.
The sequence of the distribution of elements in moss samples was Hg < Cd < As
< Pb < Ni. All the elements (except Hg) show high variations (CV% > 75%) indicating that the data are affected by different factors among different areas. It is followed by high values of skewness and kurtosis indicating a high asymmetry of the
concentration data, wide spreading of the data and strong geographical variations of
the elements in moss samples. High metal concentrations in different locations may
be associated with geochemical factors and local anthropogenic sources or
Table 2.3 Descriptive statistical analysis of 2015 AMS trace metal data (N = 55)
Element Mean Median GeoMean StDev CV% Min Max Q1
Q3
Sk K
Hg
0.059 0.049
0.049
0.040 68
0.011 0.213 0.033 0.068 1.86 4.20
Cd
0.222 0.116
0.150
0.233 105
0.045 1.015 0.083 0.247 1.98 3.32
As
0.621 0.418
0.478
0.565 91
0.130 3.182 0.318 0.734 2.71 8.58
Pb
3.011 2.376
2.06
2.80 93
0.510 14.54 1.162 3.921 2.08 5.46
Ni
17.05 7.57
8.89
23.5
138
0.680 108
4.220 19.02 2.56 6.54
Cr
10.65 9.27
8.01
9.69 91
2.21 66
4.57 13.34 3.65 19.5
Co
1.323 1.051
1.12
0.855 65
0.354 4.239 0.757 1.648 1.77 3.27
Zn
23.28 18.41
20.54
16.21 70
10.28 108
16.19 22.50 3.48 14.1
Sk skewness, K kurtosis
2 Spatial Series and Multivariate Analysis in Assessing the Essential (Cu and Zn…
IR – vegetable ingestion rate (100 g/day)
ED – exposure duration (24 year)
EF – exposure frequency (day/a) (365 day year
−1
)
BW – average body weight (70 kg for adults)
AT nc – average exposure time (365 × 24 day)
AT c – average exposure time (365 × 70 day)
LT – lifetime expected (70 year)
10
−6
– conversion factor (kg-mg)
The probability of cancer (c) risk as a result of exposure to the carcinogenic hazards was calculated according to Eq. (2.1) (EPA 2001). The carcinogenic risk (CR)
was estimated by the sum of the non-cancer (nc) and cancer (c) risk of each carcinogenic element (As, Cd, Hg and Pb). The CR < 1 × 10
−6
is considered as a carcinogenic target risk, and if the CR > 1 × 10
−4
, it is qualified as an unacceptable value
(Candeias et al. 2014).
2.3 Result and Discussion
2.3.1 Trace Metal Concentrations in Moss Samples
Only the most toxic elements that show negative health impact and environmental
risk are included. The most important parameters, such as mean, median, minimum,
maximum, coefficient of variation (CV%), skewness and kurtosis, are shown in
Table 2.3.
The sequence of the distribution of elements in moss samples was Hg < Cd < As
< Pb < Ni. All the elements (except Hg) show high variations (CV% > 75%) indicating that the data are affected by different factors among different areas. It is followed by high values of skewness and kurtosis indicating a high asymmetry of the
concentration data, wide spreading of the data and strong geographical variations of
the elements in moss samples. High metal concentrations in different locations may
be associated with geochemical factors and local anthropogenic sources or
Table 2.3 Descriptive statistical analysis of 2015 AMS trace metal data (N = 55)
Element Mean Median GeoMean StDev CV% Min Max Q1
Q3
Sk K
Hg
0.059 0.049
0.049
0.040 68
0.011 0.213 0.033 0.068 1.86 4.20
Cd
0.222 0.116
0.150
0.233 105
0.045 1.015 0.083 0.247 1.98 3.32
As
0.621 0.418
0.478
0.565 91
0.130 3.182 0.318 0.734 2.71 8.58
Pb
3.011 2.376
2.06
2.80 93
0.510 14.54 1.162 3.921 2.08 5.46
Ni
17.05 7.57
8.89
23.5
138
0.680 108
4.220 19.02 2.56 6.54
Cr
10.65 9.27
8.01
9.69 91
2.21 66
4.57 13.34 3.65 19.5
Co
1.323 1.051
1.12
0.855 65
0.354 4.239 0.757 1.648 1.77 3.27
Zn
23.28 18.41
20.54
16.21 70
10.28 108
16.19 22.50 3.48 14.1
Sk skewness, K kurtosis
2 Spatial Series and Multivariate Analysis in Assessing the Essential (Cu and Zn…