

226
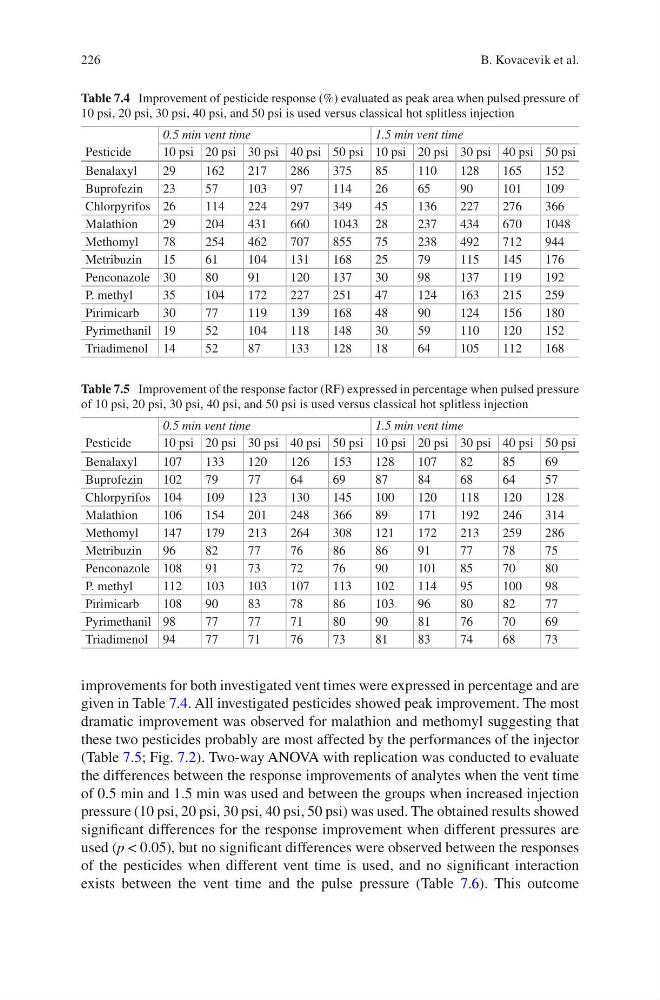
improvements for both investigated vent times were expressed in percentage and are
given in Table 7.4. All investigated pesticides showed peak improvement. The most
dramatic improvement was observed for malathion and methomyl suggesting that
these two pesticides probably are most affected by the performances of the injector
(Table 7.5; Fig. 7.2). Two-way ANOVA with replication was conducted to evaluate
the differences between the response improvements of analytes when the vent time
of 0.5 min and 1.5 min was used and between the groups when increased injection
pressure (10 psi, 20 psi, 30 psi, 40 psi, 50 psi) was used. The obtained results showed
significant differences for the response improvement when different pressures are
used (p < 0.05), but no significant differences were observed between the responses
of the pesticides when different vent time is used, and no significant interaction
exists between the vent time and the pulse pressure (Table 7.6). This outcome
Table 7.4 Improvement of pesticide response (%) evaluated as peak area when pulsed pressure of
10 psi, 20 psi, 30 psi, 40 psi, and 50 psi is used versus classical hot splitless injection
Pesticide
0.5 min vent time
1.5 min vent time
10 psi 20 psi 30 psi 40 psi 50 psi 10 psi 20 psi 30 psi 40 psi 50 psi
Benalaxyl
29
162
217
286
375
85
110
128
165
152
Buprofezin
23
57
103
97
114
26
65
90
101
109
Chlorpyrifos 26
114
224
297
349
45
136
227
276
366
Malathion
29
204
431
660
1043 28
237
434
670
1048
Methomyl
78
254
462
707
855
75
238
492
712
944
Metribuzin
15
61
104
131
168
25
79
115
145
176
Penconazole 30
80
91
120
137
30
98
137
119
192
P. methyl
35
104
172
227
251
47
124
163
215
259
Pirimicarb
30
77
119
139
168
48
90
124
156
180
Pyrimethanil 19
52
104
118
148
30
59
110
120
152
Triadimenol 14
52
87
133
128
18
64
105
112
168
Table 7.5 Improvement of the response factor (RF) expressed in percentage when pulsed pressure
of 10 psi, 20 psi, 30 psi, 40 psi, and 50 psi is used versus classical hot splitless injection
Pesticide
0.5 min vent time
1.5 min vent time
10 psi 20 psi 30 psi 40 psi 50 psi 10 psi 20 psi 30 psi 40 psi 50 psi
Benalaxyl
107
133
120
126
153
128
107
82
85
69
Buprofezin
102
79
77
64
69
87
84
68
64
57
Chlorpyrifos 104
109
123
130
145
100
120
118
120
128
Malathion
106
154
201
248
366
89
171
192
246
314
Methomyl
147
179
213
264
308
121
172
213
259
286
Metribuzin
96
82
77
76
86
86
91
77
78
75
Penconazole 108
91
73
72
76
90
101
85
70
80
P. methyl
112
103
103
107
113
102
114
95
100
98
Pirimicarb
108
90
83
78
86
103
96
80
82
77
Pyrimethanil 98
77
77
71
80
90
81
76
70
69
Triadimenol 94
77
71
76
73
81
83
74
68
73
B. Kovacevik et al.
improvements for both investigated vent times were expressed in percentage and are
given in Table 7.4. All investigated pesticides showed peak improvement. The most
dramatic improvement was observed for malathion and methomyl suggesting that
these two pesticides probably are most affected by the performances of the injector
(Table 7.5; Fig. 7.2). Two-way ANOVA with replication was conducted to evaluate
the differences between the response improvements of analytes when the vent time
of 0.5 min and 1.5 min was used and between the groups when increased injection
pressure (10 psi, 20 psi, 30 psi, 40 psi, 50 psi) was used. The obtained results showed
significant differences for the response improvement when different pressures are
used (p < 0.05), but no significant differences were observed between the responses
of the pesticides when different vent time is used, and no significant interaction
exists between the vent time and the pulse pressure (Table 7.6). This outcome
Table 7.4 Improvement of pesticide response (%) evaluated as peak area when pulsed pressure of
10 psi, 20 psi, 30 psi, 40 psi, and 50 psi is used versus classical hot splitless injection
Pesticide
0.5 min vent time
1.5 min vent time
10 psi 20 psi 30 psi 40 psi 50 psi 10 psi 20 psi 30 psi 40 psi 50 psi
Benalaxyl
29
162
217
286
375
85
110
128
165
152
Buprofezin
23
57
103
97
114
26
65
90
101
109
Chlorpyrifos 26
114
224
297
349
45
136
227
276
366
Malathion
29
204
431
660
1043 28
237
434
670
1048
Methomyl
78
254
462
707
855
75
238
492
712
944
Metribuzin
15
61
104
131
168
25
79
115
145
176
Penconazole 30
80
91
120
137
30
98
137
119
192
P. methyl
35
104
172
227
251
47
124
163
215
259
Pirimicarb
30
77
119
139
168
48
90
124
156
180
Pyrimethanil 19
52
104
118
148
30
59
110
120
152
Triadimenol 14
52
87
133
128
18
64
105
112
168
Table 7.5 Improvement of the response factor (RF) expressed in percentage when pulsed pressure
of 10 psi, 20 psi, 30 psi, 40 psi, and 50 psi is used versus classical hot splitless injection
Pesticide
0.5 min vent time
1.5 min vent time
10 psi 20 psi 30 psi 40 psi 50 psi 10 psi 20 psi 30 psi 40 psi 50 psi
Benalaxyl
107
133
120
126
153
128
107
82
85
69
Buprofezin
102
79
77
64
69
87
84
68
64
57
Chlorpyrifos 104
109
123
130
145
100
120
118
120
128
Malathion
106
154
201
248
366
89
171
192
246
314
Methomyl
147
179
213
264
308
121
172
213
259
286
Metribuzin
96
82
77
76
86
86
91
77
78
75
Penconazole 108
91
73
72
76
90
101
85
70
80
P. methyl
112
103
103
107
113
102
114
95
100
98
Pirimicarb
108
90
83
78
86
103
96
80
82
77
Pyrimethanil 98
77
77
71
80
90
81
76
70
69
Triadimenol 94
77
71
76
73
81
83
74
68
73
B. Kovacevik et al.