

227
suggests that the influence of the vent time when nonvolatile compounds are subject
to the pulsed pressure injection when single trapped glass wool liner is used is negligible. To evaluate the differences between the analyte responses when hot splitless
and increased pressure of 10 psi, 20 psi, 30 psi, 40 psi, and 50 psi are used during
the time of injection, statistically significant ANOVA was followed up by the Tukey
HSD post hoc tests for dependent samples (Tukey 1949). The result showed that the
response of the analytes at pulsed pressure of 50 psi significantly differs from the
responses of other pressures used. Statistical results suggest that the best improvement for the response will be achieved if the pressure of 50 psi is used (Table 7.7).
Taking all together and considering the improvements for the calculated response
factors (Table 7.5), it is assumed that increased injection pressure of 50 psi for vent
time of 0.5 min will significantly affect the response improvement of the investigated pesticides and most likely will improve the limit of detection in the method.
Based on the obtained results, simultaneous ion monitoring (SIM) method was
created for quantification of investigated pesticides using increased pressure of 50 psi
and vent time of 0.5 min (Table 7.8). LOD and LOQ were obtained using regression
ANOVA analysis. The obtained LODs were in the range of 0.001–0.167 ng/μl.
The method was used to investigate pesticides in groundwater. For that purpose, continuous LLE was performed using methylene chloride as a solvent. Calculated
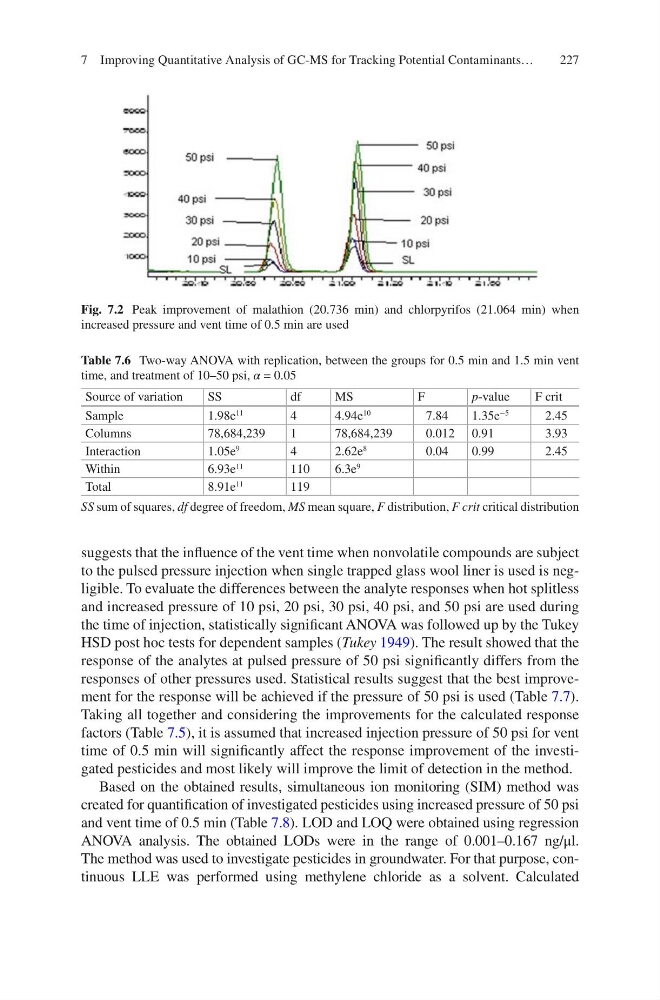
Fig. 7.2 Peak improvement of malathion (20.736 min) and chlorpyrifos (21.064 min) when
increased pressure and vent time of 0.5 min are used
Table 7.6 Two-way ANOVA with replication, between the groups for 0.5 min and 1.5 min vent
time, and treatment of 10–50 psi, α = 0.05
Source of variation
SS
df
MS
F
p-value
F crit
Sample
1.98e
11
4
4.94e
10
7.84
1.35e
−5
2.45
Columns
78,684,239
1
78,684,239
0.012 0.91
3.93
Interaction
1.05e
9
4
2.62e
8
0.04
0.99
2.45
Within
6.93e
11
110
6.3e
9
Total
8.91e
11
119
SS sum of squares, df degree of freedom, MS mean square, F distribution, F crit critical distribution
7 Improving Quantitative Analysis of GC-MS for Tracking Potential Contaminants…
suggests that the influence of the vent time when nonvolatile compounds are subject
to the pulsed pressure injection when single trapped glass wool liner is used is negligible. To evaluate the differences between the analyte responses when hot splitless
and increased pressure of 10 psi, 20 psi, 30 psi, 40 psi, and 50 psi are used during
the time of injection, statistically significant ANOVA was followed up by the Tukey
HSD post hoc tests for dependent samples (Tukey 1949). The result showed that the
response of the analytes at pulsed pressure of 50 psi significantly differs from the
responses of other pressures used. Statistical results suggest that the best improvement for the response will be achieved if the pressure of 50 psi is used (Table 7.7).
Taking all together and considering the improvements for the calculated response
factors (Table 7.5), it is assumed that increased injection pressure of 50 psi for vent
time of 0.5 min will significantly affect the response improvement of the investigated pesticides and most likely will improve the limit of detection in the method.
Based on the obtained results, simultaneous ion monitoring (SIM) method was
created for quantification of investigated pesticides using increased pressure of 50 psi
and vent time of 0.5 min (Table 7.8). LOD and LOQ were obtained using regression
ANOVA analysis. The obtained LODs were in the range of 0.001–0.167 ng/μl.
The method was used to investigate pesticides in groundwater. For that purpose, continuous LLE was performed using methylene chloride as a solvent. Calculated
Fig. 7.2 Peak improvement of malathion (20.736 min) and chlorpyrifos (21.064 min) when
increased pressure and vent time of 0.5 min are used
Table 7.6 Two-way ANOVA with replication, between the groups for 0.5 min and 1.5 min vent
time, and treatment of 10–50 psi, α = 0.05
Source of variation
SS
df
MS
F
p-value
F crit
Sample
1.98e
11
4
4.94e
10
7.84
1.35e
−5
2.45
Columns
78,684,239
1
78,684,239
0.012 0.91
3.93
Interaction
1.05e
9
4
2.62e
8
0.04
0.99
2.45
Within
6.93e
11
110
6.3e
9
Total
8.91e
11
119
SS sum of squares, df degree of freedom, MS mean square, F distribution, F crit critical distribution
7 Improving Quantitative Analysis of GC-MS for Tracking Potential Contaminants…