

119
ecological studies of this type (Sohrabinia and Khorshiddoust 2007; Ulshöfer and
Rosner 2001; Gerdol et al. 2014). The interpolation method of universal kriging
with a linear variogram (Davis 1986) is one of the most reliable methods used to
construct charts showing the formed air quality indication zones based on IAP
values. For the graphical representation of the distribution of points with different
IAP values, percentile charts (scale divisions) are used where different colors show
different IAP values.
4.5.3.1 Case Study: Integral View
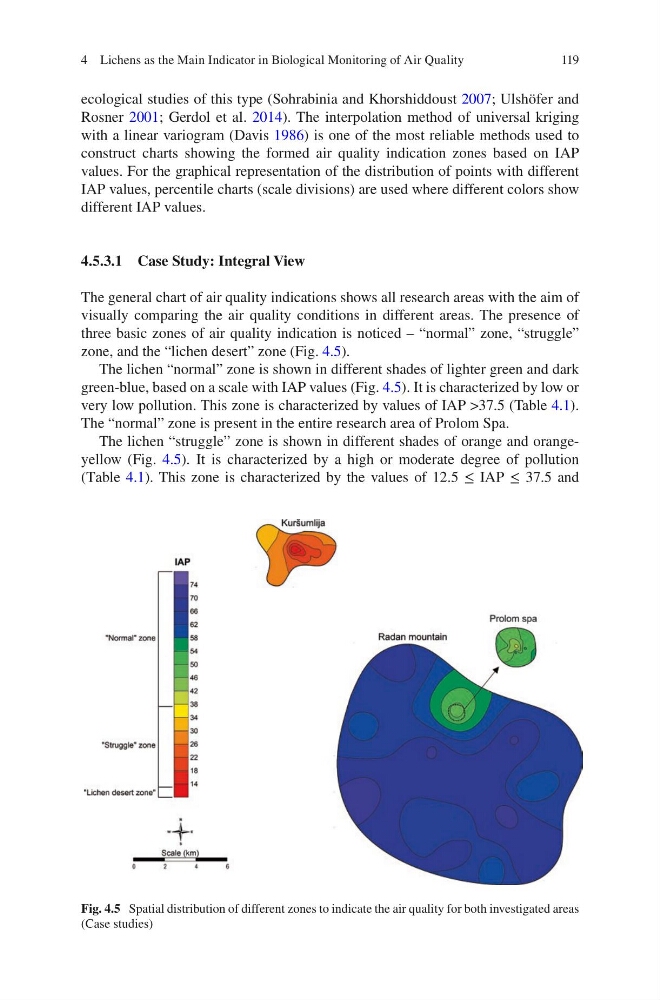
The general chart of air quality indications shows all research areas with the aim of
visually comparing the air quality conditions in different areas. The presence of
three basic zones of air quality indication is noticed – “normal” zone, “struggle”
zone, and the “lichen desert” zone (Fig. 4.5).
The lichen “normal” zone is shown in different shades of lighter green and dark
green-blue, based on a scale with IAP values (Fig. 4.5). It is characterized by low or
very low pollution. This zone is characterized by values of IAP >37.5 (Table 4.1).
The “normal” zone is present in the entire research area of Prolom Spa.
The lichen “struggle” zone is shown in different shades of orange and orangeyellow (Fig. 4.5). It is characterized by a high or moderate degree of pollution
(Tаble 4.1). This zone is characterized by the values of 12.5 ≤ IAP ≤ 37.5 and
Fig. 4.5 Spatial distribution of different zones to indicate the air quality for both investigated areas
(Case studies)
4 Lichens as the Main Indicator in Biological Monitoring of Air Quality
ecological studies of this type (Sohrabinia and Khorshiddoust 2007; Ulshöfer and
Rosner 2001; Gerdol et al. 2014). The interpolation method of universal kriging
with a linear variogram (Davis 1986) is one of the most reliable methods used to
construct charts showing the formed air quality indication zones based on IAP
values. For the graphical representation of the distribution of points with different
IAP values, percentile charts (scale divisions) are used where different colors show
different IAP values.
4.5.3.1 Case Study: Integral View
The general chart of air quality indications shows all research areas with the aim of
visually comparing the air quality conditions in different areas. The presence of
three basic zones of air quality indication is noticed – “normal” zone, “struggle”
zone, and the “lichen desert” zone (Fig. 4.5).
The lichen “normal” zone is shown in different shades of lighter green and dark
green-blue, based on a scale with IAP values (Fig. 4.5). It is characterized by low or
very low pollution. This zone is characterized by values of IAP >37.5 (Table 4.1).
The “normal” zone is present in the entire research area of Prolom Spa.
The lichen “struggle” zone is shown in different shades of orange and orangeyellow (Fig. 4.5). It is characterized by a high or moderate degree of pollution
(Tаble 4.1). This zone is characterized by the values of 12.5 ≤ IAP ≤ 37.5 and
Fig. 4.5 Spatial distribution of different zones to indicate the air quality for both investigated areas
(Case studies)
4 Lichens as the Main Indicator in Biological Monitoring of Air Quality