

110
In this research, the above formula was used as a simple and reliable model for
calculating the value of the atmospheric purity index. The aim of the research is to
observe the differences between the air quality of one anthropogenic – urban – and
one natural or seminatural ecosystem based on the variation of IAP values presented
through two case studies, the town of Kuršumlija (case study 1) and Prolom Banja
(case study 2).
4.3.1 Calculation of the Index of Atmospheric Purity
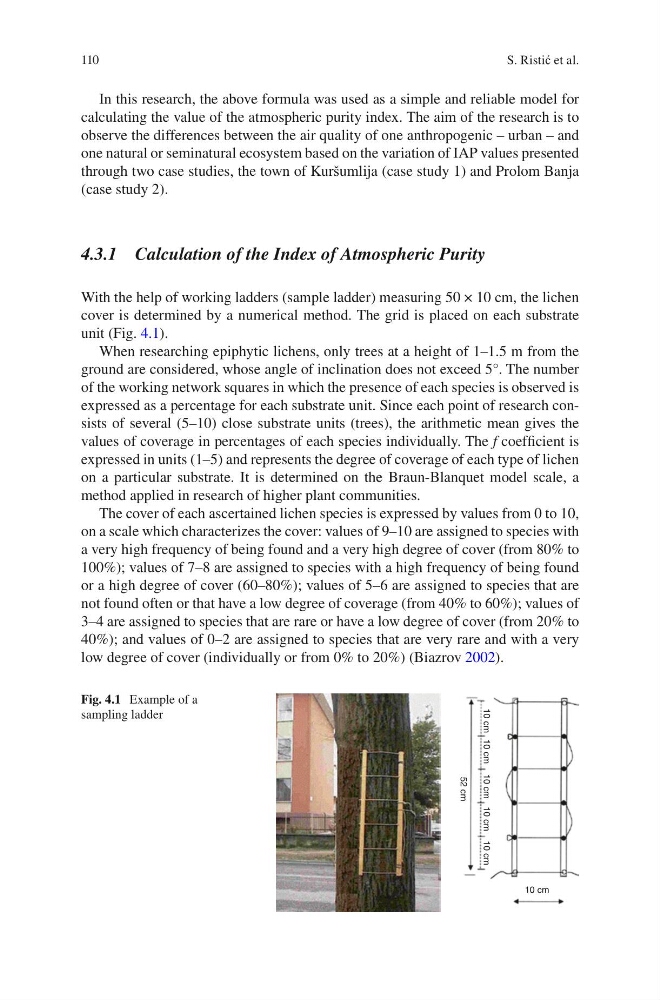
With the help of working ladders (sample ladder) measuring 50 × 10 cm, the lichen
cover is determined by a numerical method. The grid is placed on each substrate
unit (Fig. 4.1).
When researching epiphytic lichens, only trees at a height of 1–1.5 m from the
ground are considered, whose angle of inclination does not exceed 5°. The number
of the working network squares in which the presence of each species is observed is
expressed as a percentage for each substrate unit. Since each point of research consists of several (5–10) close substrate units (trees), the arithmetic mean gives the
values of coverage in percentages of each species individually. The f coefficient is
expressed in units (1–5) and represents the degree of coverage of each type of lichen
on a particular substrate. It is determined on the Braun-Blanquet model scale, a
method applied in research of higher plant communities.
The cover of each ascertained lichen species is expressed by values from 0 to 10,
on a scale which characterizes the cover: values of 9–10 are assigned to species with
a very high frequency of being found and a very high degree of cover (from 80% to
100%); values of 7–8 are assigned to species with a high frequency of being found
or a high degree of cover (60–80%); values of 5–6 are assigned to species that are
not found often or that have a low degree of coverage (from 40% to 60%); values of
3–4 are assigned to species that are rare or have a low degree of cover (from 20% to
40%); and values of 0–2 are assigned to species that are very rare and with a very
low degree of cover (individually or from 0% to 20%) (Biazrov 2002).
10 cm
10 cm
10 cm
10 cm
10 cm
10 cm
52 cm
Fig. 4.1 Example of a
sampling ladder
S. Ristić et al.
In this research, the above formula was used as a simple and reliable model for
calculating the value of the atmospheric purity index. The aim of the research is to
observe the differences between the air quality of one anthropogenic – urban – and
one natural or seminatural ecosystem based on the variation of IAP values presented
through two case studies, the town of Kuršumlija (case study 1) and Prolom Banja
(case study 2).
4.3.1 Calculation of the Index of Atmospheric Purity
With the help of working ladders (sample ladder) measuring 50 × 10 cm, the lichen
cover is determined by a numerical method. The grid is placed on each substrate
unit (Fig. 4.1).
When researching epiphytic lichens, only trees at a height of 1–1.5 m from the
ground are considered, whose angle of inclination does not exceed 5°. The number
of the working network squares in which the presence of each species is observed is
expressed as a percentage for each substrate unit. Since each point of research consists of several (5–10) close substrate units (trees), the arithmetic mean gives the
values of coverage in percentages of each species individually. The f coefficient is
expressed in units (1–5) and represents the degree of coverage of each type of lichen
on a particular substrate. It is determined on the Braun-Blanquet model scale, a
method applied in research of higher plant communities.
The cover of each ascertained lichen species is expressed by values from 0 to 10,
on a scale which characterizes the cover: values of 9–10 are assigned to species with
a very high frequency of being found and a very high degree of cover (from 80% to
100%); values of 7–8 are assigned to species with a high frequency of being found
or a high degree of cover (60–80%); values of 5–6 are assigned to species that are
not found often or that have a low degree of coverage (from 40% to 60%); values of
3–4 are assigned to species that are rare or have a low degree of cover (from 20% to
40%); and values of 0–2 are assigned to species that are very rare and with a very
low degree of cover (individually or from 0% to 20%) (Biazrov 2002).
10 cm
10 cm
10 cm
10 cm
10 cm
10 cm
52 cm
Fig. 4.1 Example of a
sampling ladder
S. Ristić et al.