

111
In the field notebook, next to each point of research, the type of substrate on
which lichens were found is recorded, as well as the values of the taxon cover coefficient at each point of research. The frequency of each type is calculated in relation
to the percentage representation on the total number of investigated points. The
ordinal numbers of the investigated points and their coordinates are entered on the
working map of the investigated area.
The studies mentioned here (cаse study 1 аnd cаse study 2) use the numerical
method of calculating the index of atmospheric purity. According to Loppi et al.
(1997) and Kricke and Loppi (2002), IAP (index of atmospheric purity) values are
calculated according to the formula:
IAP ¦ f
(4.14)
where f represents the lichen cover.
The index of atmospheric purity is calculated for each point of research within
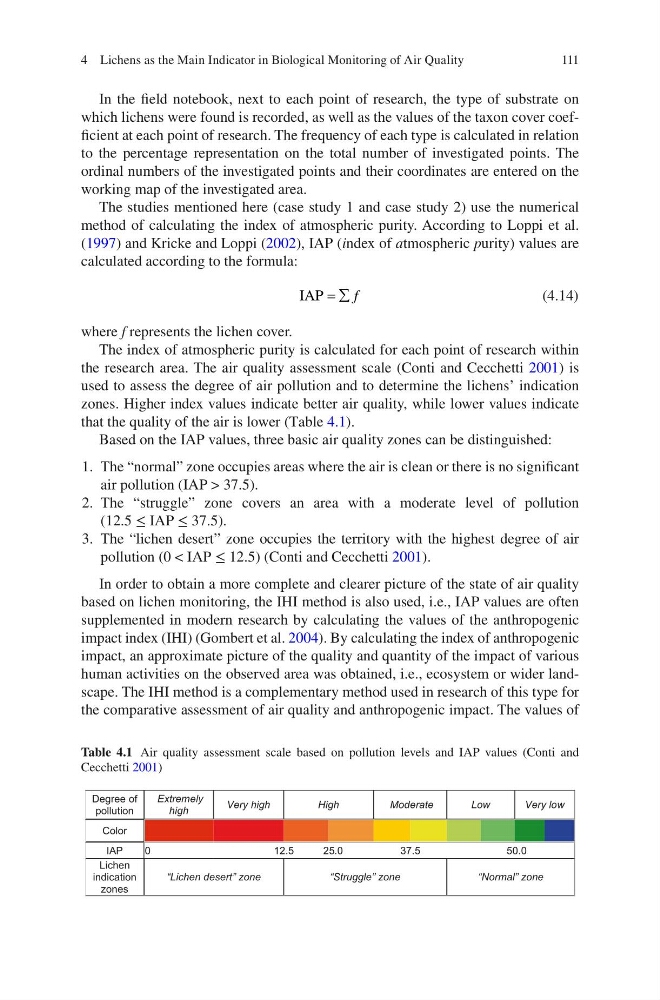
the research area. The air quality assessment scale (Conti and Cecchetti 2001) is
used to assess the degree of air pollution and to determine the lichens’ indication
zones. Higher index values indicate better air quality, while lower values indicate
that the quality of the air is lower (Tаble 4.1).
Based on the IAP values, three basic air quality zones can be distinguished:
1. The “normal” zone occupies areas where the air is clean or there is no significant
air pollution (IAP > 37.5).
2. The “struggle” zone covers an area with a moderate level of pollution
(12.5 ≤ IAP ≤ 37.5).
3. The “lichen desert” zone occupies the territory with the highest degree of air
pollution (0 < IAP ≤ 12.5) (Conti and Cecchetti 2001).
In order to obtain a more complete and clearer picture of the state of air quality
based on lichen monitoring, the IHI method is also used, i.e., IAP values are often
supplemented in modern research by calculating the values of the anthropogenic
impact index (IHI) (Gombert et al. 2004). By calculating the index of anthropogenic
impact, an approximate picture of the quality and quantity of the impact of various
human activities on the observed area was obtained, i.e., ecosystem or wider landscape. The IHI method is a complementary method used in research of this type for
the comparative assessment of air quality and anthropogenic impact. The values of
Degree of
pollution
Extremely
high
Very high
High
Moderate
Low
Very low
Color
IAP
0
12.5
25.0
37.5
50.0
Lichen
indication
zones
“Lichen desert” zone
“Struggle” zone
“Normal” zone
Table 4.1 Air quality assessment scale based on pollution levels and IAP values (Conti and
Cecchetti 2001)
4 Lichens as the Main Indicator in Biological Monitoring of Air Quality
In the field notebook, next to each point of research, the type of substrate on
which lichens were found is recorded, as well as the values of the taxon cover coefficient at each point of research. The frequency of each type is calculated in relation
to the percentage representation on the total number of investigated points. The
ordinal numbers of the investigated points and their coordinates are entered on the
working map of the investigated area.
The studies mentioned here (cаse study 1 аnd cаse study 2) use the numerical
method of calculating the index of atmospheric purity. According to Loppi et al.
(1997) and Kricke and Loppi (2002), IAP (index of atmospheric purity) values are
calculated according to the formula:
IAP ¦ f
(4.14)
where f represents the lichen cover.
The index of atmospheric purity is calculated for each point of research within
the research area. The air quality assessment scale (Conti and Cecchetti 2001) is
used to assess the degree of air pollution and to determine the lichens’ indication
zones. Higher index values indicate better air quality, while lower values indicate
that the quality of the air is lower (Tаble 4.1).
Based on the IAP values, three basic air quality zones can be distinguished:
1. The “normal” zone occupies areas where the air is clean or there is no significant
air pollution (IAP > 37.5).
2. The “struggle” zone covers an area with a moderate level of pollution
(12.5 ≤ IAP ≤ 37.5).
3. The “lichen desert” zone occupies the territory with the highest degree of air
pollution (0 < IAP ≤ 12.5) (Conti and Cecchetti 2001).
In order to obtain a more complete and clearer picture of the state of air quality
based on lichen monitoring, the IHI method is also used, i.e., IAP values are often
supplemented in modern research by calculating the values of the anthropogenic
impact index (IHI) (Gombert et al. 2004). By calculating the index of anthropogenic
impact, an approximate picture of the quality and quantity of the impact of various
human activities on the observed area was obtained, i.e., ecosystem or wider landscape. The IHI method is a complementary method used in research of this type for
the comparative assessment of air quality and anthropogenic impact. The values of
Degree of
pollution
Extremely
high
Very high
High
Moderate
Low
Very low
Color
IAP
0
12.5
25.0
37.5
50.0
Lichen
indication
zones
“Lichen desert” zone
“Struggle” zone
“Normal” zone
Table 4.1 Air quality assessment scale based on pollution levels and IAP values (Conti and
Cecchetti 2001)
4 Lichens as the Main Indicator in Biological Monitoring of Air Quality