

109
IAP
u u
¦
1
n
Q C F
(4.5)
IAP
u u
u
¦
1
n Q C F
V S
(4.6)
IAP ¦
1
n
C
(4.7)
IAP
u
u
¦
1
n C F
V S
(4.8)
IAP
u
u
¦
1
n Q C
V S
(4.9)
IAP ¦
1
n
F
(4.10)
IAP
u
¦
1
n
Q F
(4.11)
IAP ¦
1
n
Q
(4.12)
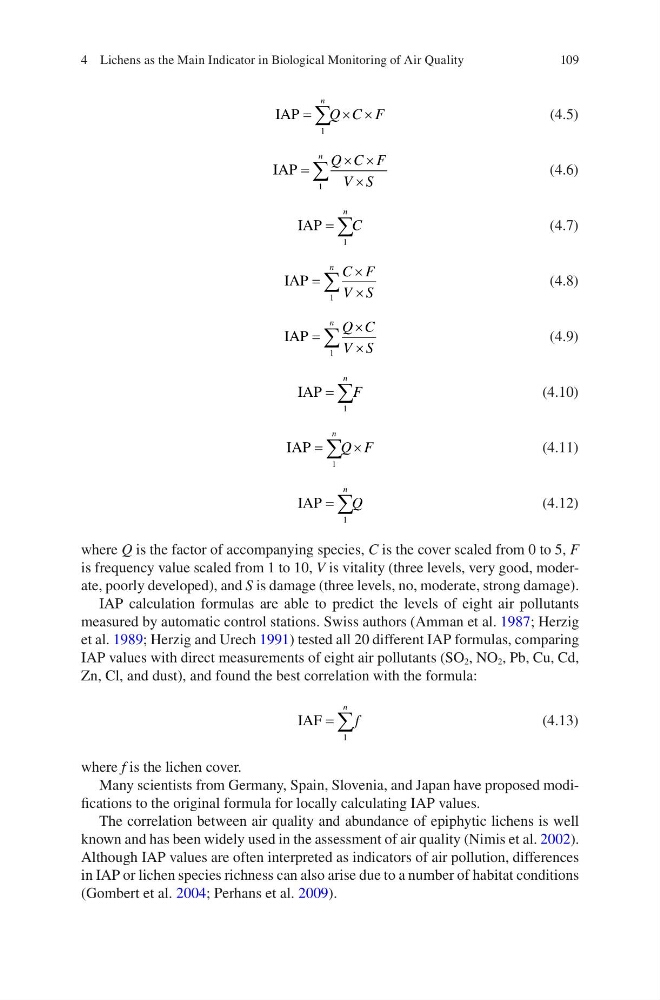
where Q is the factor of accompanying species, C is the cover scaled from 0 to 5, F
is frequency value scaled from 1 to 10, V is vitality (three levels, very good, moderate, poorly developed), and S is damage (three levels, no, moderate, strong damage).
IAP calculation formulas are able to predict the levels of eight air pollutants
measured by automatic control stations. Swiss authors (Amman et al. 1987; Herzig
et al. 1989; Herzig and Urech 1991) tested all 20 different IAP formulas, comparing
IAP values with direct measurements of eight air pollutants (SO 2 , NO 2 , Pb, Cu, Cd,
Zn, Cl, and dust), and found the best correlation with the formula:
IAF ¦
1
n
f
(4.13)
where f is the lichen cover.
Many scientists from Germany, Spain, Slovenia, and Japan have proposed modifications to the original formula for locally calculating IAP values.
The correlation between air quality and abundance of epiphytic lichens is well
known and has been widely used in the assessment of air quality (Nimis et al. 2002).
Although IAP values are often interpreted as indicators of air pollution, differences
in IAP or lichen species richness can also arise due to a number of habitat conditions
(Gombert et al. 2004; Perhans et al. 2009).
4 Lichens as the Main Indicator in Biological Monitoring of Air Quality
IAP
u u
¦
1
n
Q C F
(4.5)
IAP
u u
u
¦
1
n Q C F
V S
(4.6)
IAP ¦
1
n
C
(4.7)
IAP
u
u
¦
1
n C F
V S
(4.8)
IAP
u
u
¦
1
n Q C
V S
(4.9)
IAP ¦
1
n
F
(4.10)
IAP
u
¦
1
n
Q F
(4.11)
IAP ¦
1
n
Q
(4.12)
where Q is the factor of accompanying species, C is the cover scaled from 0 to 5, F
is frequency value scaled from 1 to 10, V is vitality (three levels, very good, moderate, poorly developed), and S is damage (three levels, no, moderate, strong damage).
IAP calculation formulas are able to predict the levels of eight air pollutants
measured by automatic control stations. Swiss authors (Amman et al. 1987; Herzig
et al. 1989; Herzig and Urech 1991) tested all 20 different IAP formulas, comparing
IAP values with direct measurements of eight air pollutants (SO 2 , NO 2 , Pb, Cu, Cd,
Zn, Cl, and dust), and found the best correlation with the formula:
IAF ¦
1
n
f
(4.13)
where f is the lichen cover.
Many scientists from Germany, Spain, Slovenia, and Japan have proposed modifications to the original formula for locally calculating IAP values.
The correlation between air quality and abundance of epiphytic lichens is well
known and has been widely used in the assessment of air quality (Nimis et al. 2002).
Although IAP values are often interpreted as indicators of air pollution, differences
in IAP or lichen species richness can also arise due to a number of habitat conditions
(Gombert et al. 2004; Perhans et al. 2009).
4 Lichens as the Main Indicator in Biological Monitoring of Air Quality