

Carbon Footprint of Food Waste Management: A Case …
47
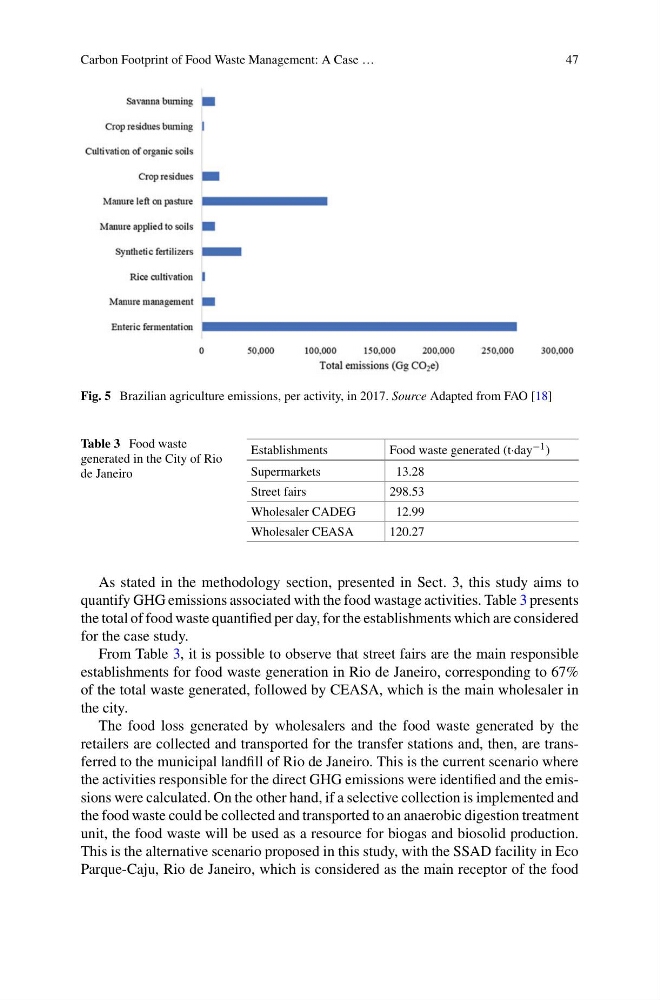
Fig. 5 Brazilian agriculture emissions, per activity, in 2017. Source Adapted from FAO [18]
Table 3 Food waste
generated in the City of Rio
de Janeiro
Establishments
Food waste generated (t·day −1 )
Supermarkets
13.28
Street fairs
298.53
Wholesaler CADEG
12.99
Wholesaler CEASA
120.27
As stated in the methodology section, presented in Sect. 3, this study aims to
quantify GHG emissions associated with the food wastage activities. Table 3 presents
the total of food waste quantified per day, for the establishments which are considered
for the case study.
From Table 3, it is possible to observe that street fairs are the main responsible
establishments for food waste generation in Rio de Janeiro, corresponding to 67%
of the total waste generated, followed by CEASA, which is the main wholesaler in
the city.
The food loss generated by wholesalers and the food waste generated by the
retailers are collected and transported for the transfer stations and, then, are transferred to the municipal landfill of Rio de Janeiro. This is the current scenario where
the activities responsible for the direct GHG emissions were identified and the emissions were calculated. On the other hand, if a selective collection is implemented and
the food waste could be collected and transported to an anaerobic digestion treatment
unit, the food waste will be used as a resource for biogas and biosolid production.
This is the alternative scenario proposed in this study, with the SSAD facility in Eco
Parque-Caju, Rio de Janeiro, which is considered as the main receptor of the food
47
Fig. 5 Brazilian agriculture emissions, per activity, in 2017. Source Adapted from FAO [18]
Table 3 Food waste
generated in the City of Rio
de Janeiro
Establishments
Food waste generated (t·day −1 )
Supermarkets
13.28
Street fairs
298.53
Wholesaler CADEG
12.99
Wholesaler CEASA
120.27
As stated in the methodology section, presented in Sect. 3, this study aims to
quantify GHG emissions associated with the food wastage activities. Table 3 presents
the total of food waste quantified per day, for the establishments which are considered
for the case study.
From Table 3, it is possible to observe that street fairs are the main responsible
establishments for food waste generation in Rio de Janeiro, corresponding to 67%
of the total waste generated, followed by CEASA, which is the main wholesaler in
the city.
The food loss generated by wholesalers and the food waste generated by the
retailers are collected and transported for the transfer stations and, then, are transferred to the municipal landfill of Rio de Janeiro. This is the current scenario where
the activities responsible for the direct GHG emissions were identified and the emissions were calculated. On the other hand, if a selective collection is implemented and
the food waste could be collected and transported to an anaerobic digestion treatment
unit, the food waste will be used as a resource for biogas and biosolid production.
This is the alternative scenario proposed in this study, with the SSAD facility in Eco
Parque-Caju, Rio de Janeiro, which is considered as the main receptor of the food