

48
L. S. Franca et al.
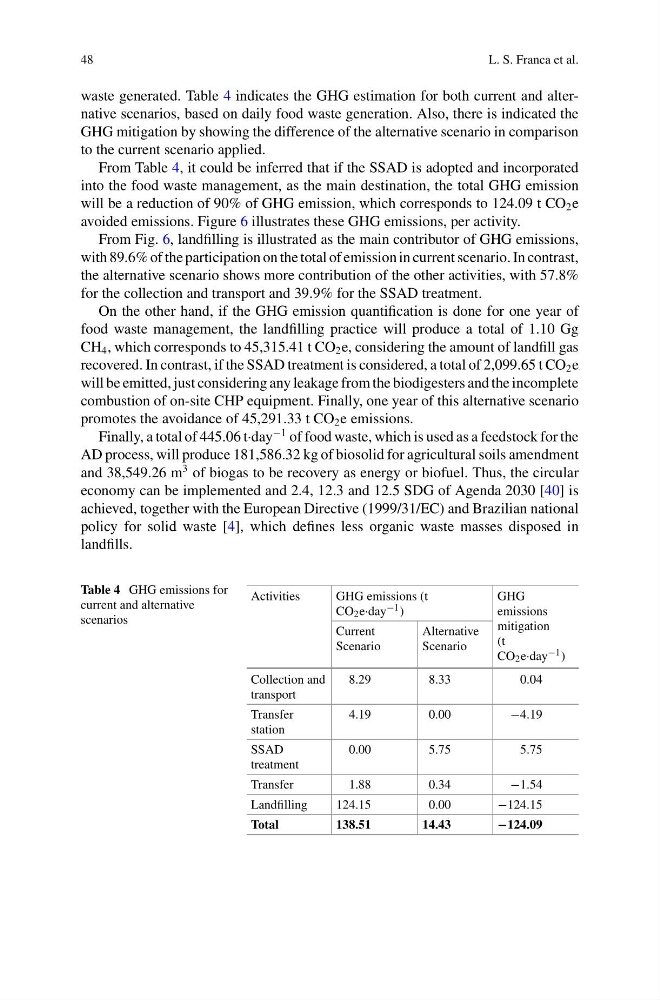
waste generated. Table 4 indicates the GHG estimation for both current and alternative scenarios, based on daily food waste generation. Also, there is indicated the
GHG mitigation by showing the difference of the alternative scenario in comparison
to the current scenario applied.
From Table 4, it could be inferred that if the SSAD is adopted and incorporated
into the food waste management, as the main destination, the total GHG emission
will be a reduction of 90% of GHG emission, which corresponds to 124.09 t CO 2 e
avoided emissions. Figure 6 illustrates these GHG emissions, per activity.
From Fig. 6, landfilling is illustrated as the main contributor of GHG emissions,
with 89.6% of the participation on the total of emission in current scenario. In contrast,
the alternative scenario shows more contribution of the other activities, with 57.8%
for the collection and transport and 39.9% for the SSAD treatment.
On the other hand, if the GHG emission quantification is done for one year of
food waste management, the landfilling practice will produce a total of 1.10 Gg
CH 4 , which corresponds to 45,315.41 t CO 2 e, considering the amount of landfill gas
recovered. In contrast, if the SSAD treatment is considered, a total of 2,099.65 t CO 2 e
will be emitted, just considering any leakage from the biodigesters and the incomplete
combustion of on-site CHP equipment. Finally, one year of this alternative scenario
promotes the avoidance of 45,291.33 t CO 2 e emissions.
Finally, a total of 445.06 t·day
−1 of food waste, which is used as a feedstock for the
AD process, will produce 181,586.32 kg of biosolid for agricultural soils amendment
and 38,549.26 m
3 of biogas to be recovery as energy or biofuel. Thus, the circular
economy can be implemented and 2.4, 12.3 and 12.5 SDG of Agenda 2030 [40] is
achieved, together with the European Directive (1999/31/EC) and Brazilian national
policy for solid waste [4], which defines less organic waste masses disposed in
landfills.
Table 4 GHG emissions for
current and alternative
scenarios
Activities
GHG emissions (t
CO 2 e·day −1 )
GHG
emissions
mitigation
(t
CO 2 e·day −1 )
Current
Scenario
Alternative
Scenario
Collection and
transport
8.29
8.33
0.04
Transfer
station
4.19
0.00
−4.19
SSAD
treatment
0.00
5.75
5.75
Transfer
1.88
0.34
−1.54
Landfilling
124.15
0.00
−124.15
Total
138.51
14.43
−124.09
L. S. Franca et al.
waste generated. Table 4 indicates the GHG estimation for both current and alternative scenarios, based on daily food waste generation. Also, there is indicated the
GHG mitigation by showing the difference of the alternative scenario in comparison
to the current scenario applied.
From Table 4, it could be inferred that if the SSAD is adopted and incorporated
into the food waste management, as the main destination, the total GHG emission
will be a reduction of 90% of GHG emission, which corresponds to 124.09 t CO 2 e
avoided emissions. Figure 6 illustrates these GHG emissions, per activity.
From Fig. 6, landfilling is illustrated as the main contributor of GHG emissions,
with 89.6% of the participation on the total of emission in current scenario. In contrast,
the alternative scenario shows more contribution of the other activities, with 57.8%
for the collection and transport and 39.9% for the SSAD treatment.
On the other hand, if the GHG emission quantification is done for one year of
food waste management, the landfilling practice will produce a total of 1.10 Gg
CH 4 , which corresponds to 45,315.41 t CO 2 e, considering the amount of landfill gas
recovered. In contrast, if the SSAD treatment is considered, a total of 2,099.65 t CO 2 e
will be emitted, just considering any leakage from the biodigesters and the incomplete
combustion of on-site CHP equipment. Finally, one year of this alternative scenario
promotes the avoidance of 45,291.33 t CO 2 e emissions.
Finally, a total of 445.06 t·day
−1 of food waste, which is used as a feedstock for the
AD process, will produce 181,586.32 kg of biosolid for agricultural soils amendment
and 38,549.26 m
3 of biogas to be recovery as energy or biofuel. Thus, the circular
economy can be implemented and 2.4, 12.3 and 12.5 SDG of Agenda 2030 [40] is
achieved, together with the European Directive (1999/31/EC) and Brazilian national
policy for solid waste [4], which defines less organic waste masses disposed in
landfills.
Table 4 GHG emissions for
current and alternative
scenarios
Activities
GHG emissions (t
CO 2 e·day −1 )
GHG
emissions
mitigation
(t
CO 2 e·day −1 )
Current
Scenario
Alternative
Scenario
Collection and
transport
8.29
8.33
0.04
Transfer
station
4.19
0.00
−4.19
SSAD
treatment
0.00
5.75
5.75
Transfer
1.88
0.34
−1.54
Landfilling
124.15
0.00
−124.15
Total
138.51
14.43
−124.09