

46
L. S. Franca et al.
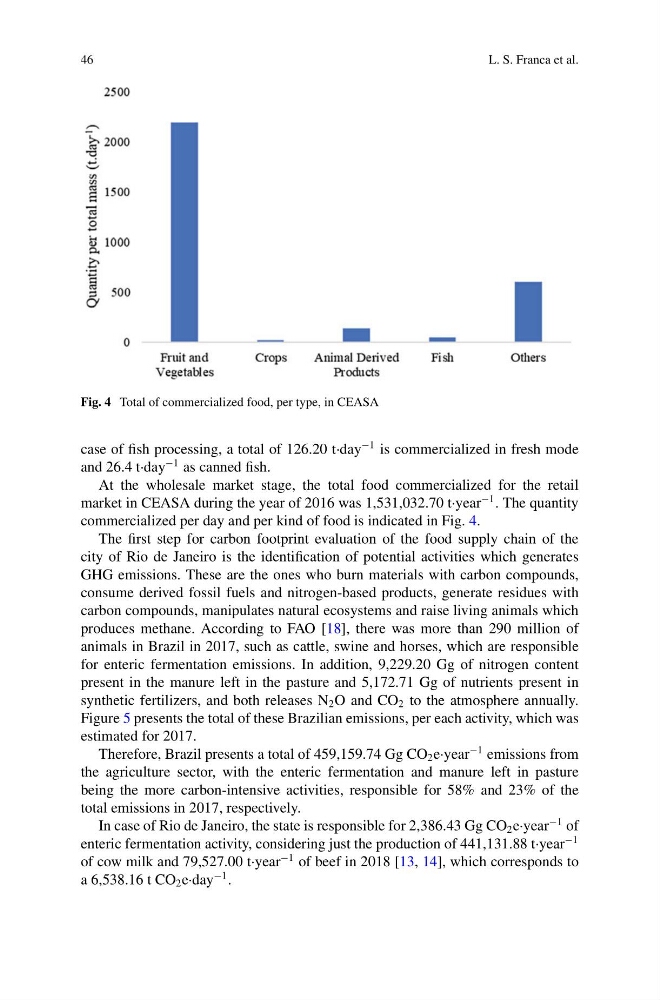
Fig. 4 Total of commercialized food, per type, in CEASA
case of fish processing, a total of 126.20 t·day
−1 is commercialized in fresh mode
and 26.4 t·day
−1 as canned fish.
At the wholesale market stage, the total food commercialized for the retail
market in CEASA during the year of 2016 was 1,531,032.70 t·year
−1 . The quantity
commercialized per day and per kind of food is indicated in Fig. 4.
The first step for carbon footprint evaluation of the food supply chain of the
city of Rio de Janeiro is the identification of potential activities which generates
GHG emissions. These are the ones who burn materials with carbon compounds,
consume derived fossil fuels and nitrogen-based products, generate residues with
carbon compounds, manipulates natural ecosystems and raise living animals which
produces methane. According to FAO [18], there was more than 290 million of
animals in Brazil in 2017, such as cattle, swine and horses, which are responsible
for enteric fermentation emissions. In addition, 9,229.20 Gg of nitrogen content
present in the manure left in the pasture and 5,172.71 Gg of nutrients present in
synthetic fertilizers, and both releases N 2 O and CO 2 to the atmosphere annually.
Figure 5 presents the total of these Brazilian emissions, per each activity, which was
estimated for 2017.
Therefore, Brazil presents a total of 459,159.74 Gg CO 2 e·year
−1 emissions from
the agriculture sector, with the enteric fermentation and manure left in pasture
being the more carbon-intensive activities, responsible for 58% and 23% of the
total emissions in 2017, respectively.
In case of Rio de Janeiro, the state is responsible for 2,386.43 Gg CO 2 e·year
−1 of
enteric fermentation activity, considering just the production of 441,131.88 t·year
−1
of cow milk and 79,527.00 t·year
−1 of beef in 2018 [13, 14], which corresponds to
a 6,538.16 t CO 2 e·day
−1 .
L. S. Franca et al.
Fig. 4 Total of commercialized food, per type, in CEASA
case of fish processing, a total of 126.20 t·day
−1 is commercialized in fresh mode
and 26.4 t·day
−1 as canned fish.
At the wholesale market stage, the total food commercialized for the retail
market in CEASA during the year of 2016 was 1,531,032.70 t·year
−1 . The quantity
commercialized per day and per kind of food is indicated in Fig. 4.
The first step for carbon footprint evaluation of the food supply chain of the
city of Rio de Janeiro is the identification of potential activities which generates
GHG emissions. These are the ones who burn materials with carbon compounds,
consume derived fossil fuels and nitrogen-based products, generate residues with
carbon compounds, manipulates natural ecosystems and raise living animals which
produces methane. According to FAO [18], there was more than 290 million of
animals in Brazil in 2017, such as cattle, swine and horses, which are responsible
for enteric fermentation emissions. In addition, 9,229.20 Gg of nitrogen content
present in the manure left in the pasture and 5,172.71 Gg of nutrients present in
synthetic fertilizers, and both releases N 2 O and CO 2 to the atmosphere annually.
Figure 5 presents the total of these Brazilian emissions, per each activity, which was
estimated for 2017.
Therefore, Brazil presents a total of 459,159.74 Gg CO 2 e·year
−1 emissions from
the agriculture sector, with the enteric fermentation and manure left in pasture
being the more carbon-intensive activities, responsible for 58% and 23% of the
total emissions in 2017, respectively.
In case of Rio de Janeiro, the state is responsible for 2,386.43 Gg CO 2 e·year
−1 of
enteric fermentation activity, considering just the production of 441,131.88 t·year
−1
of cow milk and 79,527.00 t·year
−1 of beef in 2018 [13, 14], which corresponds to
a 6,538.16 t CO 2 e·day
−1 .