

Greenhouse Gas Emissions from Municipal Solid Waste Management …
141
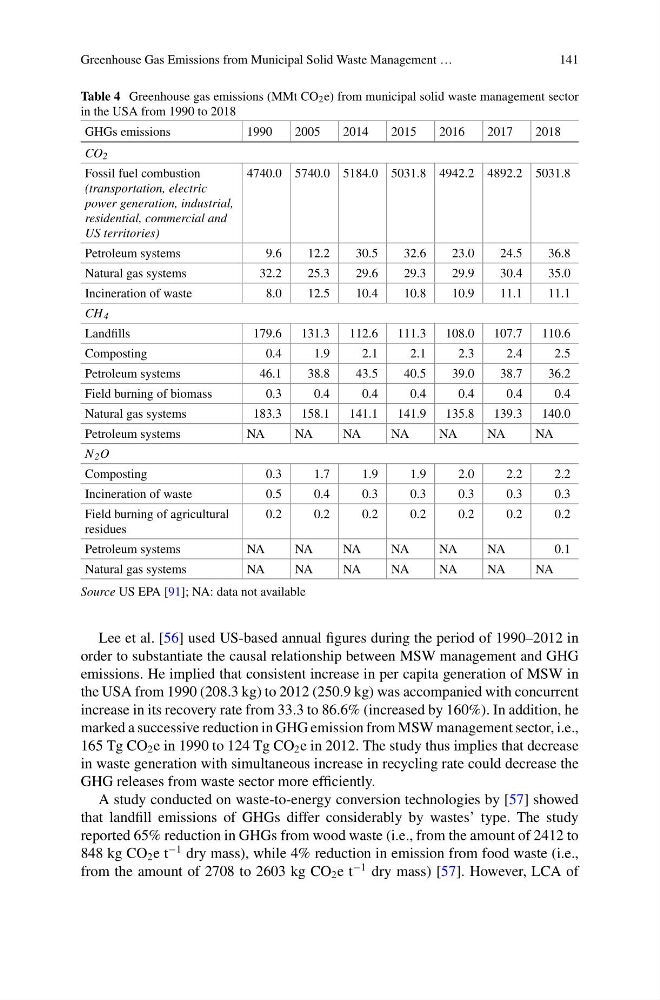
Table 4 Greenhouse gas emissions (MMt CO 2 e) from municipal solid waste management sector
in the USA from 1990 to 2018
GHGs emissions
1990
2005
2014
2015
2016
2017
2018
CO 2
Fossil fuel combustion
(transportation, electric
power generation, industrial,
residential, commercial and
US territories)
4740.0 5740.0 5184.0 5031.8 4942.2 4892.2 5031.8
Petroleum systems
9.6
12.2
30.5
32.6
23.0
24.5
36.8
Natural gas systems
32.2
25.3
29.6
29.3
29.9
30.4
35.0
Incineration of waste
8.0
12.5
10.4
10.8
10.9
11.1
11.1
CH 4
Landfills
179.6
131.3
112.6
111.3
108.0
107.7
110.6
Composting
0.4
1.9
2.1
2.1
2.3
2.4
2.5
Petroleum systems
46.1
38.8
43.5
40.5
39.0
38.7
36.2
Field burning of biomass
0.3
0.4
0.4
0.4
0.4
0.4
0.4
Natural gas systems
183.3
158.1
141.1
141.9
135.8
139.3
140.0
Petroleum systems
NA
NA
NA
NA
NA
NA
NA
N 2 O
Composting
0.3
1.7
1.9
1.9
2.0
2.2
2.2
Incineration of waste
0.5
0.4
0.3
0.3
0.3
0.3
0.3
Field burning of agricultural
residues
0.2
0.2
0.2
0.2
0.2
0.2
0.2
Petroleum systems
NA
NA
NA
NA
NA
NA
0.1
Natural gas systems
NA
NA
NA
NA
NA
NA
NA
Source US EPA [91]; NA: data not available
Lee et al. [56] used US-based annual figures during the period of 1990–2012 in
order to substantiate the causal relationship between MSW management and GHG
emissions. He implied that consistent increase in per capita generation of MSW in
the USA from 1990 (208.3 kg) to 2012 (250.9 kg) was accompanied with concurrent
increase in its recovery rate from 33.3 to 86.6% (increased by 160%). In addition, he
marked a successive reduction in GHG emission from MSW management sector, i.e.,
165 Tg CO 2 e in 1990 to 124 Tg CO 2 e in 2012. The study thus implies that decrease
in waste generation with simultaneous increase in recycling rate could decrease the
GHG releases from waste sector more efficiently.
A study conducted on waste-to-energy conversion technologies by [57] showed
that landfill emissions of GHGs differ considerably by wastes’ type. The study
reported 65% reduction in GHGs from wood waste (i.e., from the amount of 2412 to
848 kg CO 2 e t
−1 dry mass), while 4% reduction in emission from food waste (i.e.,
from the amount of 2708 to 2603 kg CO 2 e t
−1 dry mass) [57]. However, LCA of
141
Table 4 Greenhouse gas emissions (MMt CO 2 e) from municipal solid waste management sector
in the USA from 1990 to 2018
GHGs emissions
1990
2005
2014
2015
2016
2017
2018
CO 2
Fossil fuel combustion
(transportation, electric
power generation, industrial,
residential, commercial and
US territories)
4740.0 5740.0 5184.0 5031.8 4942.2 4892.2 5031.8
Petroleum systems
9.6
12.2
30.5
32.6
23.0
24.5
36.8
Natural gas systems
32.2
25.3
29.6
29.3
29.9
30.4
35.0
Incineration of waste
8.0
12.5
10.4
10.8
10.9
11.1
11.1
CH 4
Landfills
179.6
131.3
112.6
111.3
108.0
107.7
110.6
Composting
0.4
1.9
2.1
2.1
2.3
2.4
2.5
Petroleum systems
46.1
38.8
43.5
40.5
39.0
38.7
36.2
Field burning of biomass
0.3
0.4
0.4
0.4
0.4
0.4
0.4
Natural gas systems
183.3
158.1
141.1
141.9
135.8
139.3
140.0
Petroleum systems
NA
NA
NA
NA
NA
NA
NA
N 2 O
Composting
0.3
1.7
1.9
1.9
2.0
2.2
2.2
Incineration of waste
0.5
0.4
0.3
0.3
0.3
0.3
0.3
Field burning of agricultural
residues
0.2
0.2
0.2
0.2
0.2
0.2
0.2
Petroleum systems
NA
NA
NA
NA
NA
NA
0.1
Natural gas systems
NA
NA
NA
NA
NA
NA
NA
Source US EPA [91]; NA: data not available
Lee et al. [56] used US-based annual figures during the period of 1990–2012 in
order to substantiate the causal relationship between MSW management and GHG
emissions. He implied that consistent increase in per capita generation of MSW in
the USA from 1990 (208.3 kg) to 2012 (250.9 kg) was accompanied with concurrent
increase in its recovery rate from 33.3 to 86.6% (increased by 160%). In addition, he
marked a successive reduction in GHG emission from MSW management sector, i.e.,
165 Tg CO 2 e in 1990 to 124 Tg CO 2 e in 2012. The study thus implies that decrease
in waste generation with simultaneous increase in recycling rate could decrease the
GHG releases from waste sector more efficiently.
A study conducted on waste-to-energy conversion technologies by [57] showed
that landfill emissions of GHGs differ considerably by wastes’ type. The study
reported 65% reduction in GHGs from wood waste (i.e., from the amount of 2412 to
848 kg CO 2 e t
−1 dry mass), while 4% reduction in emission from food waste (i.e.,
from the amount of 2708 to 2603 kg CO 2 e t
−1 dry mass) [57]. However, LCA of