

84
E. N. Udemba
Table 1 Summary of variables
Definition of
variables
Short form Measurement
Source
Literature
Ecological footprint LnEFP
Constant per
capita
Global Footprint
Network
[27, 2, 20, 34, 38]
Economic growth
LnGDP
GDP per capita
(constant 2010,
US$)
World Bank
Development
Indicators (WDI)
[39]
Shahbaz et al., [31]
Squared economic
growth
LnGDP 2
GDP per capita
(constant 2010,
US$)
World Bank
Development
Indicators (WDI),
[39]
[14]
Energy use
LnEU
Energy use
(million tonnes
oil equivalent)
[25] British
Petroleum (BP)
statistical review
Shahbaz et al., [30]
Agriculture
LnAg
Agriculture,
forestry, and
fishing, value
added (constant
2010 US$)
World Bank
Development
Indicators (WDI),
[39]
[18] and Ullah
et al., [37]
Population
LnPop
Urban
population
World Bank
Development
Indicators (WDI),
[39]
Wang et al., [40].
Source Author’s compilation
+ a 4 ln EU t−1 + a 5 ln AG t−1 + a 6 ln POP t−1 +
ρ−1
i=0
δ 1 ln EFP t−i
+
q−1
i=0
δ 2 ln GDP t−i +
q−1
i=0
δ 3 ln GDP
2
t−i +
q−1
i=0
δ 4 ln EU t−i
+
q−1
i=0
δ 5 ln AG t−i +
q−1
i=0
δ 6 ln POP t−i + ECM t−i + μ t
(3)
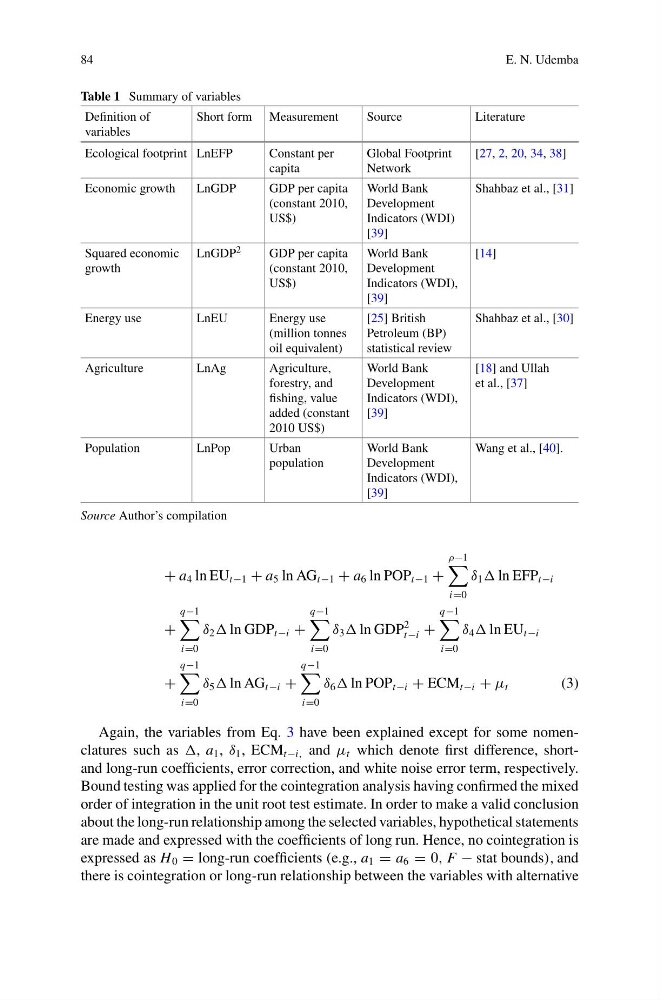
Again, the variables from Eq. 3 have been explained except for some nomenclatures such as , a 1 , δ 1 , ECM t−i, and μ t which denote first difference, shortand long-run coefficients, error correction, and white noise error term, respectively.
Bound testing was applied for the cointegration analysis having confirmed the mixed
order of integration in the unit root test estimate. In order to make a valid conclusion
about the long-run relationship among the selected variables, hypothetical statements
are made and expressed with the coefficients of long run. Hence, no cointegration is
expressed as H 0 = long-run coefficients (e.g., a 1 = a 6 = 0, F − stat bounds), and
there is cointegration or long-run relationship between the variables with alternative
E. N. Udemba
Table 1 Summary of variables
Definition of
variables
Short form Measurement
Source
Literature
Ecological footprint LnEFP
Constant per
capita
Global Footprint
Network
[27, 2, 20, 34, 38]
Economic growth
LnGDP
GDP per capita
(constant 2010,
US$)
World Bank
Development
Indicators (WDI)
[39]
Shahbaz et al., [31]
Squared economic
growth
LnGDP 2
GDP per capita
(constant 2010,
US$)
World Bank
Development
Indicators (WDI),
[39]
[14]
Energy use
LnEU
Energy use
(million tonnes
oil equivalent)
[25] British
Petroleum (BP)
statistical review
Shahbaz et al., [30]
Agriculture
LnAg
Agriculture,
forestry, and
fishing, value
added (constant
2010 US$)
World Bank
Development
Indicators (WDI),
[39]
[18] and Ullah
et al., [37]
Population
LnPop
Urban
population
World Bank
Development
Indicators (WDI),
[39]
Wang et al., [40].
Source Author’s compilation
+ a 4 ln EU t−1 + a 5 ln AG t−1 + a 6 ln POP t−1 +
ρ−1
i=0
δ 1 ln EFP t−i
+
q−1
i=0
δ 2 ln GDP t−i +
q−1
i=0
δ 3 ln GDP
2
t−i +
q−1
i=0
δ 4 ln EU t−i
+
q−1
i=0
δ 5 ln AG t−i +
q−1
i=0
δ 6 ln POP t−i + ECM t−i + μ t
(3)
Again, the variables from Eq. 3 have been explained except for some nomenclatures such as , a 1 , δ 1 , ECM t−i, and μ t which denote first difference, shortand long-run coefficients, error correction, and white noise error term, respectively.
Bound testing was applied for the cointegration analysis having confirmed the mixed
order of integration in the unit root test estimate. In order to make a valid conclusion
about the long-run relationship among the selected variables, hypothetical statements
are made and expressed with the coefficients of long run. Hence, no cointegration is
expressed as H 0 = long-run coefficients (e.g., a 1 = a 6 = 0, F − stat bounds), and
there is cointegration or long-run relationship between the variables with alternative