

32
C. Rivero-Camacho et al.
1.11%
32.35%
4.88%
16.45%
18.91%
1.90%
7.71%
3.37% 3.83%
1.64%
7.85%
16.55%
3.84%
19.51%
0.48%
9.21%
14.25%
3.74%
16.08%
6.65%
7.39%
2.62%
1.10%
32.74%
Land transformaƟon
Building
Renewall 20
Renewall 40
Renewall 70
DemoliƟon
Electricity 0-20
Electricity 21-40
a)
b)
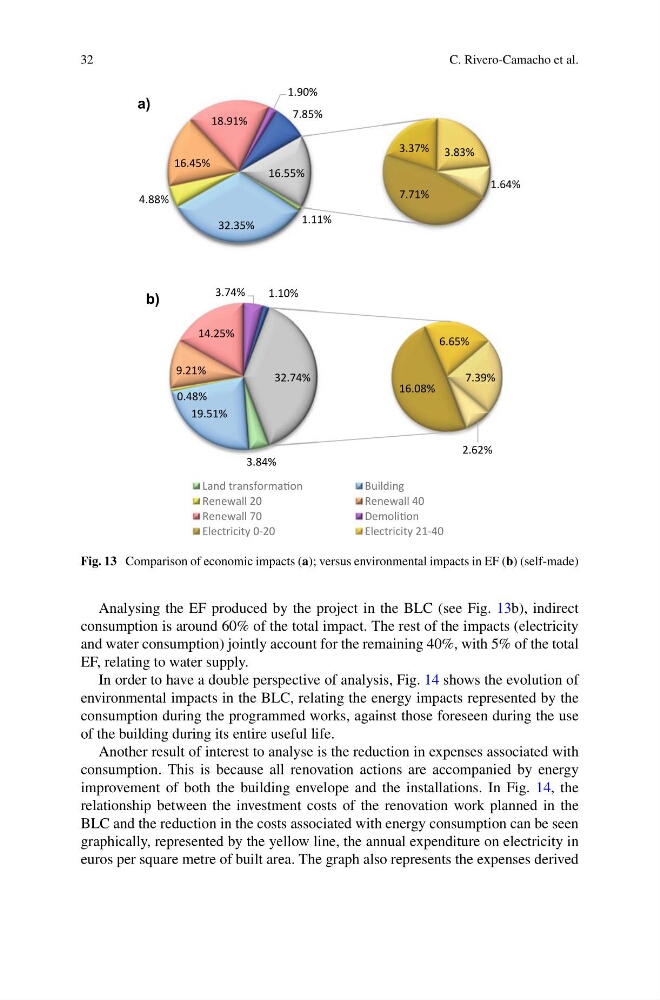
Fig. 13 Comparison of economic impacts (a); versus environmental impacts in EF (b) (self-made)
Analysing the EF produced by the project in the BLC (see Fig. 13b), indirect
consumption is around 60% of the total impact. The rest of the impacts (electricity
and water consumption) jointly account for the remaining 40%, with 5% of the total
EF, relating to water supply.
In order to have a double perspective of analysis, Fig. 14 shows the evolution of
environmental impacts in the BLC, relating the energy impacts represented by the
consumption during the programmed works, against those foreseen during the use
of the building during its entire useful life.
Another result of interest to analyse is the reduction in expenses associated with
consumption. This is because all renovation actions are accompanied by energy
improvement of both the building envelope and the installations. In Fig. 14, the
relationship between the investment costs of the renovation work planned in the
BLC and the reduction in the costs associated with energy consumption can be seen
graphically, represented by the yellow line, the annual expenditure on electricity in
euros per square metre of built area. The graph also represents the expenses derived
C. Rivero-Camacho et al.
1.11%
32.35%
4.88%
16.45%
18.91%
1.90%
7.71%
3.37% 3.83%
1.64%
7.85%
16.55%
3.84%
19.51%
0.48%
9.21%
14.25%
3.74%
16.08%
6.65%
7.39%
2.62%
1.10%
32.74%
Land transformaƟon
Building
Renewall 20
Renewall 40
Renewall 70
DemoliƟon
Electricity 0-20
Electricity 21-40
a)
b)
Fig. 13 Comparison of economic impacts (a); versus environmental impacts in EF (b) (self-made)
Analysing the EF produced by the project in the BLC (see Fig. 13b), indirect
consumption is around 60% of the total impact. The rest of the impacts (electricity
and water consumption) jointly account for the remaining 40%, with 5% of the total
EF, relating to water supply.
In order to have a double perspective of analysis, Fig. 14 shows the evolution of
environmental impacts in the BLC, relating the energy impacts represented by the
consumption during the programmed works, against those foreseen during the use
of the building during its entire useful life.
Another result of interest to analyse is the reduction in expenses associated with
consumption. This is because all renovation actions are accompanied by energy
improvement of both the building envelope and the installations. In Fig. 14, the
relationship between the investment costs of the renovation work planned in the
BLC and the reduction in the costs associated with energy consumption can be seen
graphically, represented by the yellow line, the annual expenditure on electricity in
euros per square metre of built area. The graph also represents the expenses derived