

Hydrogeophysical Investigations Using DC Resistivity …
277
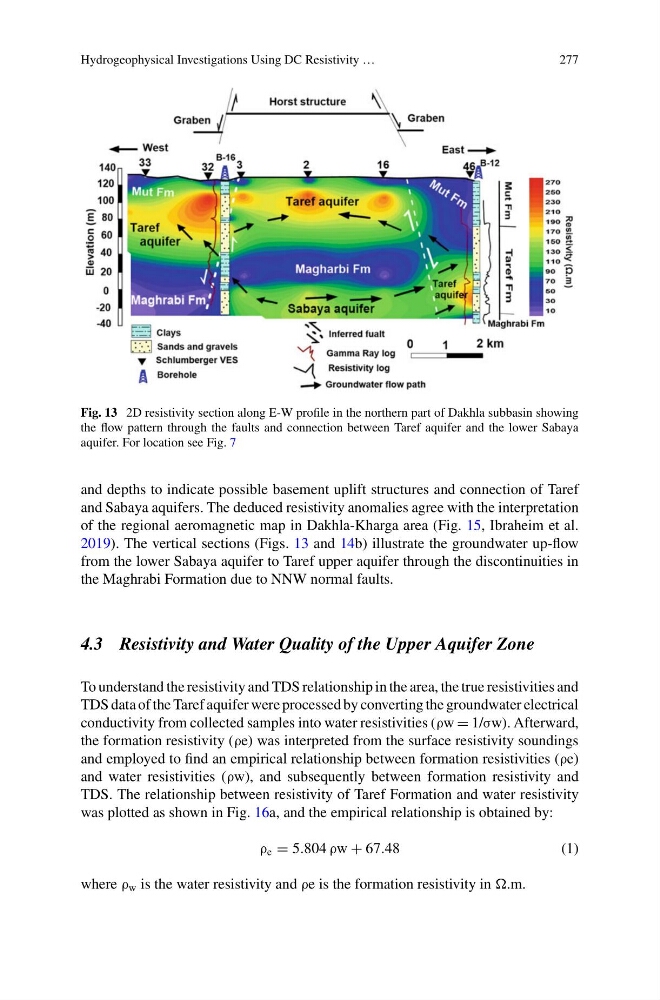
Fig. 13 2D resistivity section along E-W profile in the northern part of Dakhla subbasin showing
the flow pattern through the faults and connection between Taref aquifer and the lower Sabaya
aquifer. For location see Fig. 7
and depths to indicate possible basement uplift structures and connection of Taref
and Sabaya aquifers. The deduced resistivity anomalies agree with the interpretation
of the regional aeromagnetic map in Dakhla-Kharga area (Fig. 15, Ibraheim et al.
2019). The vertical sections (Figs. 13 and 14b) illustrate the groundwater up-flow
from the lower Sabaya aquifer to Taref upper aquifer through the discontinuities in
the Maghrabi Formation due to NNW normal faults.
4.3 Resistivity and Water Quality of the Upper Aquifer Zone
To understand the resistivity and TDS relationship in the area, the true resistivities and
TDS data of the Taref aquifer were processed by converting the groundwater electrical
conductivity from collected samples into water resistivities (ρw = 1/σw). Afterward,
the formation resistivity (ρe) was interpreted from the surface resistivity soundings
and employed to find an empirical relationship between formation resistivities (ρe)
and water resistivities (ρw), and subsequently between formation resistivity and
TDS. The relationship between resistivity of Taref Formation and water resistivity
was plotted as shown in Fig. 16a, and the empirical relationship is obtained by:
ρ e = 5.804 ρw + 67.48
(1)
where ρ w is the water resistivity and ρe is the formation resistivity in .m.
277
Fig. 13 2D resistivity section along E-W profile in the northern part of Dakhla subbasin showing
the flow pattern through the faults and connection between Taref aquifer and the lower Sabaya
aquifer. For location see Fig. 7
and depths to indicate possible basement uplift structures and connection of Taref
and Sabaya aquifers. The deduced resistivity anomalies agree with the interpretation
of the regional aeromagnetic map in Dakhla-Kharga area (Fig. 15, Ibraheim et al.
2019). The vertical sections (Figs. 13 and 14b) illustrate the groundwater up-flow
from the lower Sabaya aquifer to Taref upper aquifer through the discontinuities in
the Maghrabi Formation due to NNW normal faults.
4.3 Resistivity and Water Quality of the Upper Aquifer Zone
To understand the resistivity and TDS relationship in the area, the true resistivities and
TDS data of the Taref aquifer were processed by converting the groundwater electrical
conductivity from collected samples into water resistivities (ρw = 1/σw). Afterward,
the formation resistivity (ρe) was interpreted from the surface resistivity soundings
and employed to find an empirical relationship between formation resistivities (ρe)
and water resistivities (ρw), and subsequently between formation resistivity and
TDS. The relationship between resistivity of Taref Formation and water resistivity
was plotted as shown in Fig. 16a, and the empirical relationship is obtained by:
ρ e = 5.804 ρw + 67.48
(1)
where ρ w is the water resistivity and ρe is the formation resistivity in .m.