

278
K. S. Gemail et al.
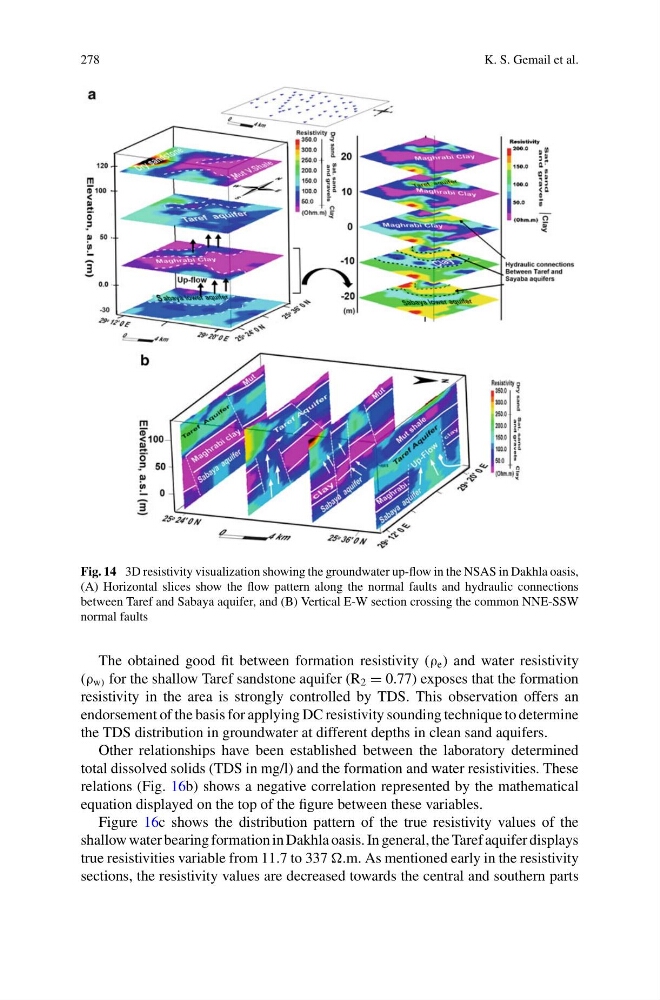
Fig. 14 3D resistivity visualization showing the groundwater up-flow in the NSAS in Dakhla oasis,
(A) Horizontal slices show the flow pattern along the normal faults and hydraulic connections
between Taref and Sabaya aquifer, and (B) Vertical E-W section crossing the common NNE-SSW
normal faults
The obtained good fit between formation resistivity (ρ e ) and water resistivity
(ρ w) for the shallow Taref sandstone aquifer (R 2 = 0.77) exposes that the formation
resistivity in the area is strongly controlled by TDS. This observation offers an
endorsement of the basis for applying DC resistivity sounding technique to determine
the TDS distribution in groundwater at different depths in clean sand aquifers.
Other relationships have been established between the laboratory determined
total dissolved solids (TDS in mg/l) and the formation and water resistivities. These
relations (Fig. 16b) shows a negative correlation represented by the mathematical
equation displayed on the top of the figure between these variables.
Figure 16c shows the distribution pattern of the true resistivity values of the
shallow water bearing formation in Dakhla oasis. In general, the Taref aquifer displays
true resistivities variable from 11.7 to 337 .m. As mentioned early in the resistivity
sections, the resistivity values are decreased towards the central and southern parts
K. S. Gemail et al.
Fig. 14 3D resistivity visualization showing the groundwater up-flow in the NSAS in Dakhla oasis,
(A) Horizontal slices show the flow pattern along the normal faults and hydraulic connections
between Taref and Sabaya aquifer, and (B) Vertical E-W section crossing the common NNE-SSW
normal faults
The obtained good fit between formation resistivity (ρ e ) and water resistivity
(ρ w) for the shallow Taref sandstone aquifer (R 2 = 0.77) exposes that the formation
resistivity in the area is strongly controlled by TDS. This observation offers an
endorsement of the basis for applying DC resistivity sounding technique to determine
the TDS distribution in groundwater at different depths in clean sand aquifers.
Other relationships have been established between the laboratory determined
total dissolved solids (TDS in mg/l) and the formation and water resistivities. These
relations (Fig. 16b) shows a negative correlation represented by the mathematical
equation displayed on the top of the figure between these variables.
Figure 16c shows the distribution pattern of the true resistivity values of the
shallow water bearing formation in Dakhla oasis. In general, the Taref aquifer displays
true resistivities variable from 11.7 to 337 .m. As mentioned early in the resistivity
sections, the resistivity values are decreased towards the central and southern parts