

276
K. S. Gemail et al.
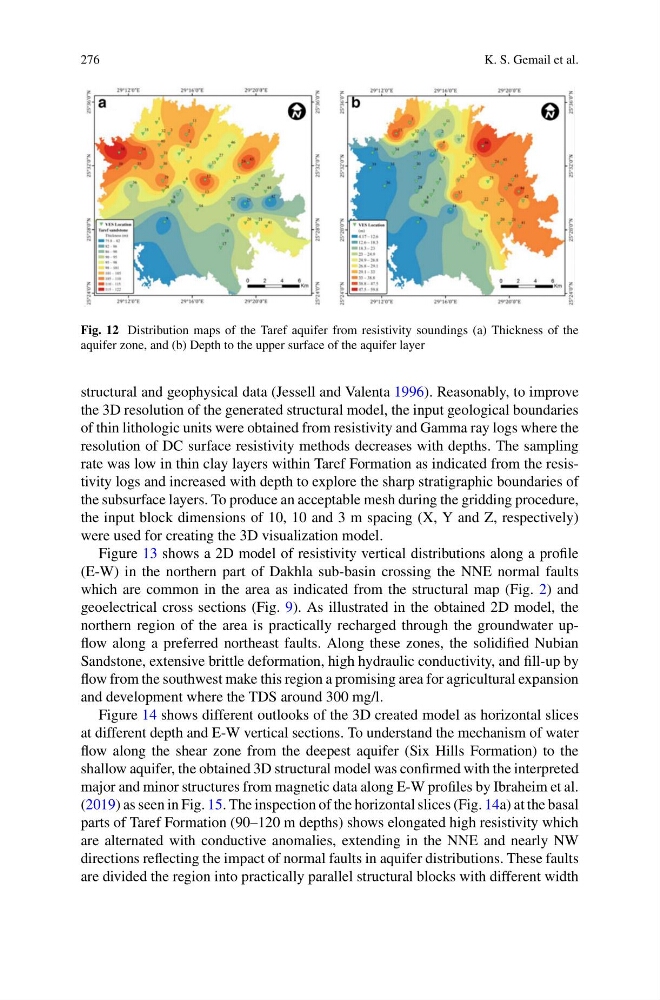
Fig. 12 Distribution maps of the Taref aquifer from resistivity soundings (a) Thickness of the
aquifer zone, and (b) Depth to the upper surface of the aquifer layer
structural and geophysical data (Jessell and Valenta 1996). Reasonably, to improve
the 3D resolution of the generated structural model, the input geological boundaries
of thin lithologic units were obtained from resistivity and Gamma ray logs where the
resolution of DC surface resistivity methods decreases with depths. The sampling
rate was low in thin clay layers within Taref Formation as indicated from the resistivity logs and increased with depth to explore the sharp stratigraphic boundaries of
the subsurface layers. To produce an acceptable mesh during the gridding procedure,
the input block dimensions of 10, 10 and 3 m spacing (X, Y and Z, respectively)
were used for creating the 3D visualization model.
Figure 13 shows a 2D model of resistivity vertical distributions along a profile
(E-W) in the northern part of Dakhla sub-basin crossing the NNE normal faults
which are common in the area as indicated from the structural map (Fig. 2) and
geoelectrical cross sections (Fig. 9). As illustrated in the obtained 2D model, the
northern region of the area is practically recharged through the groundwater upflow along a preferred northeast faults. Along these zones, the solidified Nubian
Sandstone, extensive brittle deformation, high hydraulic conductivity, and fill-up by
flow from the southwest make this region a promising area for agricultural expansion
and development where the TDS around 300 mg/l.
Figure 14 shows different outlooks of the 3D created model as horizontal slices
at different depth and E-W vertical sections. To understand the mechanism of water
flow along the shear zone from the deepest aquifer (Six Hills Formation) to the
shallow aquifer, the obtained 3D structural model was confirmed with the interpreted
major and minor structures from magnetic data along E-W profiles by Ibraheim et al.
(2019) as seen in Fig. 15. The inspection of the horizontal slices (Fig. 14a) at the basal
parts of Taref Formation (90–120 m depths) shows elongated high resistivity which
are alternated with conductive anomalies, extending in the NNE and nearly NW
directions reflecting the impact of normal faults in aquifer distributions. These faults
are divided the region into practically parallel structural blocks with different width
K. S. Gemail et al.
Fig. 12 Distribution maps of the Taref aquifer from resistivity soundings (a) Thickness of the
aquifer zone, and (b) Depth to the upper surface of the aquifer layer
structural and geophysical data (Jessell and Valenta 1996). Reasonably, to improve
the 3D resolution of the generated structural model, the input geological boundaries
of thin lithologic units were obtained from resistivity and Gamma ray logs where the
resolution of DC surface resistivity methods decreases with depths. The sampling
rate was low in thin clay layers within Taref Formation as indicated from the resistivity logs and increased with depth to explore the sharp stratigraphic boundaries of
the subsurface layers. To produce an acceptable mesh during the gridding procedure,
the input block dimensions of 10, 10 and 3 m spacing (X, Y and Z, respectively)
were used for creating the 3D visualization model.
Figure 13 shows a 2D model of resistivity vertical distributions along a profile
(E-W) in the northern part of Dakhla sub-basin crossing the NNE normal faults
which are common in the area as indicated from the structural map (Fig. 2) and
geoelectrical cross sections (Fig. 9). As illustrated in the obtained 2D model, the
northern region of the area is practically recharged through the groundwater upflow along a preferred northeast faults. Along these zones, the solidified Nubian
Sandstone, extensive brittle deformation, high hydraulic conductivity, and fill-up by
flow from the southwest make this region a promising area for agricultural expansion
and development where the TDS around 300 mg/l.
Figure 14 shows different outlooks of the 3D created model as horizontal slices
at different depth and E-W vertical sections. To understand the mechanism of water
flow along the shear zone from the deepest aquifer (Six Hills Formation) to the
shallow aquifer, the obtained 3D structural model was confirmed with the interpreted
major and minor structures from magnetic data along E-W profiles by Ibraheim et al.
(2019) as seen in Fig. 15. The inspection of the horizontal slices (Fig. 14a) at the basal
parts of Taref Formation (90–120 m depths) shows elongated high resistivity which
are alternated with conductive anomalies, extending in the NNE and nearly NW
directions reflecting the impact of normal faults in aquifer distributions. These faults
are divided the region into practically parallel structural blocks with different width