

Crop Diversification and Its Efficiency …
173
Table 6 Frequency
distributions of efficiency
scores
Efficiency
CRS-TE
VRS-TE
SE
0.0 < Efficiency < 0.2
131
121
4
(70.1)
(64.7)
(2.1)
0.2 < Efficiency < 0.4
46
50
1
(24.6)
(26.7)
(0.5)
0.4 < Efficiency < 0.6
2
4
1
(1.1)
(2.1)
(0.5)
0.6 < Efficiency < 0.8
3
3
9
(1.6)
(1.9)
(4.8)
0.8 < Efficiency < 1.0
5
9
172
(2.7)
(4.8)
(92.0)
Mean
0.175
0.202
0.943
Standard deviation
0.177
0.212
0.153
Minimum
0.006
0.007
0.047
Maximum
1.000
1.000
1.000
Note Percentages are in parentheses
of the heads of households. The ratio of family labor to total labor, family labor ratio,
is added to examine the effect of intensive use of family labor.
4 Empirical Results and Discussion
4.1 Empirical Results
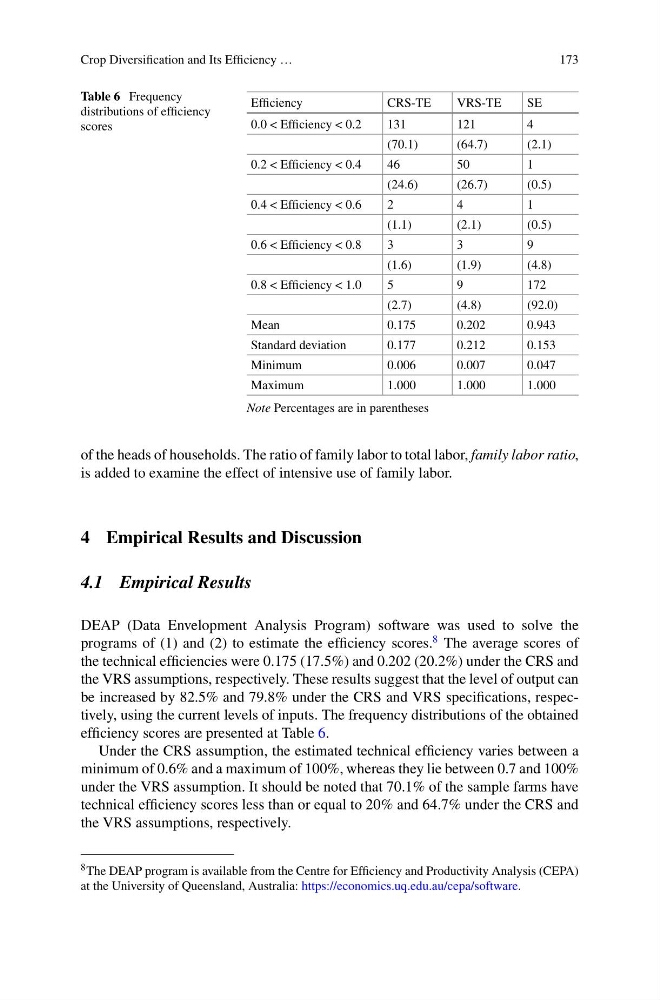
DEAP (Data Envelopment Analysis Program) software was used to solve the
programs of (1) and (2) to estimate the efficiency scores.
8 The average scores of
the technical efficiencies were 0.175 (17.5%) and 0.202 (20.2%) under the CRS and
the VRS assumptions, respectively. These results suggest that the level of output can
be increased by 82.5% and 79.8% under the CRS and VRS specifications, respectively, using the current levels of inputs. The frequency distributions of the obtained
efficiency scores are presented at Table 6.
Under the CRS assumption, the estimated technical efficiency varies between a
minimum of 0.6% and a maximum of 100%, whereas they lie between 0.7 and 100%
under the VRS assumption. It should be noted that 70.1% of the sample farms have
technical efficiency scores less than or equal to 20% and 64.7% under the CRS and
the VRS assumptions, respectively.
8 The DEAP program is available from the Centre for Efficiency and Productivity Analysis (CEPA)
at the University of Queensland, Australia: https://economics.uq.edu.au/cepa/software.
173
Table 6 Frequency
distributions of efficiency
scores
Efficiency
CRS-TE
VRS-TE
SE
0.0 < Efficiency < 0.2
131
121
4
(70.1)
(64.7)
(2.1)
0.2 < Efficiency < 0.4
46
50
1
(24.6)
(26.7)
(0.5)
0.4 < Efficiency < 0.6
2
4
1
(1.1)
(2.1)
(0.5)
0.6 < Efficiency < 0.8
3
3
9
(1.6)
(1.9)
(4.8)
0.8 < Efficiency < 1.0
5
9
172
(2.7)
(4.8)
(92.0)
Mean
0.175
0.202
0.943
Standard deviation
0.177
0.212
0.153
Minimum
0.006
0.007
0.047
Maximum
1.000
1.000
1.000
Note Percentages are in parentheses
of the heads of households. The ratio of family labor to total labor, family labor ratio,
is added to examine the effect of intensive use of family labor.
4 Empirical Results and Discussion
4.1 Empirical Results
DEAP (Data Envelopment Analysis Program) software was used to solve the
programs of (1) and (2) to estimate the efficiency scores.
8 The average scores of
the technical efficiencies were 0.175 (17.5%) and 0.202 (20.2%) under the CRS and
the VRS assumptions, respectively. These results suggest that the level of output can
be increased by 82.5% and 79.8% under the CRS and VRS specifications, respectively, using the current levels of inputs. The frequency distributions of the obtained
efficiency scores are presented at Table 6.
Under the CRS assumption, the estimated technical efficiency varies between a
minimum of 0.6% and a maximum of 100%, whereas they lie between 0.7 and 100%
under the VRS assumption. It should be noted that 70.1% of the sample farms have
technical efficiency scores less than or equal to 20% and 64.7% under the CRS and
the VRS assumptions, respectively.
8 The DEAP program is available from the Centre for Efficiency and Productivity Analysis (CEPA)
at the University of Queensland, Australia: https://economics.uq.edu.au/cepa/software.