

172
E. Iwasaki and K. Kashiwagi
3.2 Data
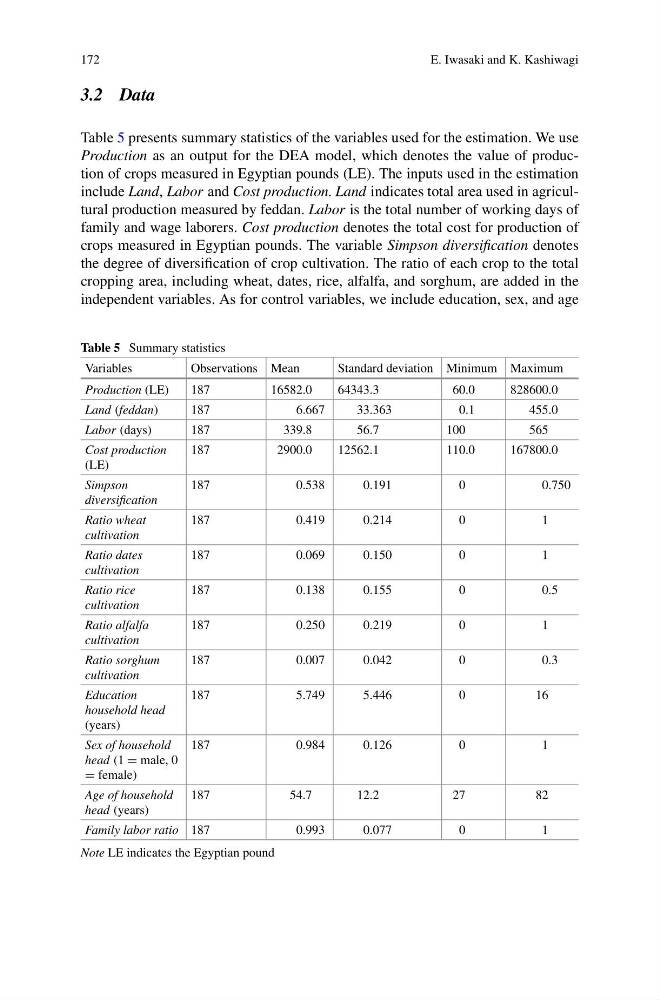
Table 5 presents summary statistics of the variables used for the estimation. We use
Production as an output for the DEA model, which denotes the value of production of crops measured in Egyptian pounds (LE). The inputs used in the estimation
include Land, Labor and Cost production. Land indicates total area used in agricultural production measured by feddan. Labor is the total number of working days of
family and wage laborers. Cost production denotes the total cost for production of
crops measured in Egyptian pounds. The variable Simpson diversification denotes
the degree of diversification of crop cultivation. The ratio of each crop to the total
cropping area, including wheat, dates, rice, alfalfa, and sorghum, are added in the
independent variables. As for control variables, we include education, sex, and age
Table 5 Summary statistics
Variables
Observations Mean
Standard deviation Minimum Maximum
Production (LE)
187
16582.0
64343.3
60.0
828600.0
Land (feddan)
187
6.667
33.363
0.1
455.0
Labor (days)
187
339.8
56.7
100
565
Cost production
(LE)
187
2900.0
12562.1
110.0
167800.0
Simpson
diversification
187
0.538
0.191
0
0.750
Ratio wheat
cultivation
187
0.419
0.214
0
1
Ratio dates
cultivation
187
0.069
0.150
0
1
Ratio rice
cultivation
187
0.138
0.155
0
0.5
Ratio alfalfa
cultivation
187
0.250
0.219
0
1
Ratio sorghum
cultivation
187
0.007
0.042
0
0.3
Education
household head
(years)
187
5.749
5.446
0
16
Sex of household
head (1 = male, 0
= female)
187
0.984
0.126
0
1
Age of household
head (years)
187
54.7
12.2
27
82
Family labor ratio 187
0.993
0.077
0
1
Note LE indicates the Egyptian pound
E. Iwasaki and K. Kashiwagi
3.2 Data
Table 5 presents summary statistics of the variables used for the estimation. We use
Production as an output for the DEA model, which denotes the value of production of crops measured in Egyptian pounds (LE). The inputs used in the estimation
include Land, Labor and Cost production. Land indicates total area used in agricultural production measured by feddan. Labor is the total number of working days of
family and wage laborers. Cost production denotes the total cost for production of
crops measured in Egyptian pounds. The variable Simpson diversification denotes
the degree of diversification of crop cultivation. The ratio of each crop to the total
cropping area, including wheat, dates, rice, alfalfa, and sorghum, are added in the
independent variables. As for control variables, we include education, sex, and age
Table 5 Summary statistics
Variables
Observations Mean
Standard deviation Minimum Maximum
Production (LE)
187
16582.0
64343.3
60.0
828600.0
Land (feddan)
187
6.667
33.363
0.1
455.0
Labor (days)
187
339.8
56.7
100
565
Cost production
(LE)
187
2900.0
12562.1
110.0
167800.0
Simpson
diversification
187
0.538
0.191
0
0.750
Ratio wheat
cultivation
187
0.419
0.214
0
1
Ratio dates
cultivation
187
0.069
0.150
0
1
Ratio rice
cultivation
187
0.138
0.155
0
0.5
Ratio alfalfa
cultivation
187
0.250
0.219
0
1
Ratio sorghum
cultivation
187
0.007
0.042
0
0.3
Education
household head
(years)
187
5.749
5.446
0
16
Sex of household
head (1 = male, 0
= female)
187
0.984
0.126
0
1
Age of household
head (years)
187
54.7
12.2
27
82
Family labor ratio 187
0.993
0.077
0
1
Note LE indicates the Egyptian pound