

Crop Diversification and Its Efficiency …
171
follows:
Max
η,λ
η,
s.t x i − Xλ ≥ 0,
ηy i − Y λ ≥ 0,
N 1
λ = 1,
λ ≥ 0
(2)
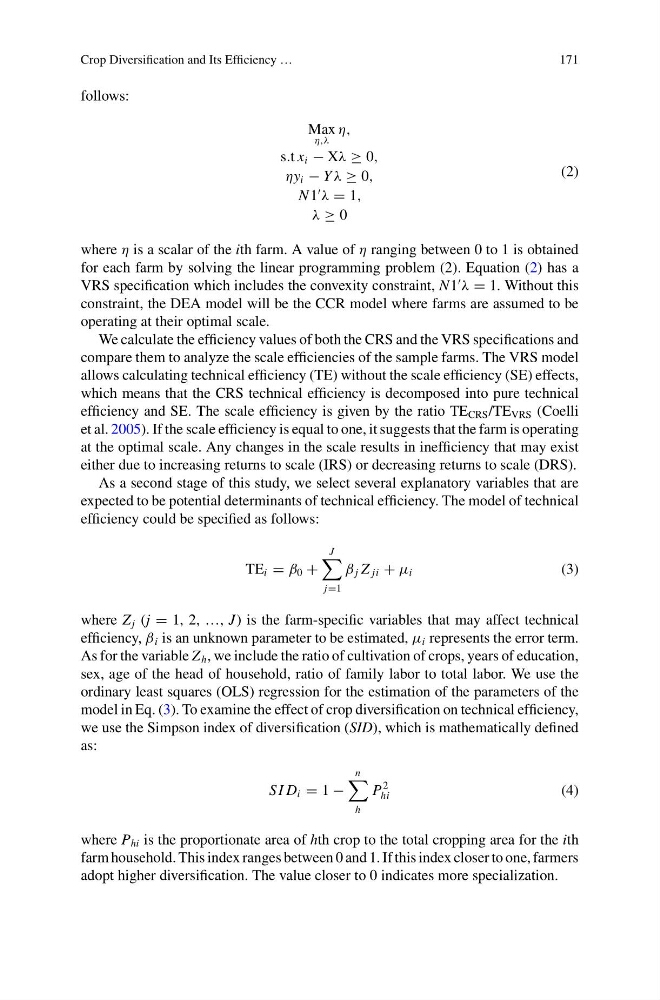
where η is a scalar of the ith farm. A value of η ranging between 0 to 1 is obtained
for each farm by solving the linear programming problem (2). Equation (2) has a
VRS specification which includes the convexity constraint, N1
λ = 1. Without this
constraint, the DEA model will be the CCR model where farms are assumed to be
operating at their optimal scale.
We calculate the efficiency values of both the CRS and the VRS specifications and
compare them to analyze the scale efficiencies of the sample farms. The VRS model
allows calculating technical efficiency (TE) without the scale efficiency (SE) effects,
which means that the CRS technical efficiency is decomposed into pure technical
efficiency and SE. The scale efficiency is given by the ratio TE CRS /TE VRS (Coelli
et al. 2005). If the scale efficiency is equal to one, it suggests that the farm is operating
at the optimal scale. Any changes in the scale results in inefficiency that may exist
either due to increasing returns to scale (IRS) or decreasing returns to scale (DRS).
As a second stage of this study, we select several explanatory variables that are
expected to be potential determinants of technical efficiency. The model of technical
efficiency could be specified as follows:
TE i = β 0 +
J
j=1
β j Z ji + μ i
(3)
where Z j (j = 1, 2, …, J) is the farm-specific variables that may affect technical
efficiency, β i is an unknown parameter to be estimated, μ i represents the error term.
As for the variable Z h , we include the ratio of cultivation of crops, years of education,
sex, age of the head of household, ratio of family labor to total labor. We use the
ordinary least squares (OLS) regression for the estimation of the parameters of the
model in Eq. (3). To examine the effect of crop diversification on technical efficiency,
we use the Simpson index of diversification (SID), which is mathematically defined
as:
S I D i = 1 −
n
h
P
2
hi
(4)
where P hi is the proportionate area of hth crop to the total cropping area for the ith
farm household. This index ranges between 0 and 1. If this index closer to one, farmers
adopt higher diversification. The value closer to 0 indicates more specialization.
171
follows:
Max
η,λ
η,
s.t x i − Xλ ≥ 0,
ηy i − Y λ ≥ 0,
N 1
λ = 1,
λ ≥ 0
(2)
where η is a scalar of the ith farm. A value of η ranging between 0 to 1 is obtained
for each farm by solving the linear programming problem (2). Equation (2) has a
VRS specification which includes the convexity constraint, N1
λ = 1. Without this
constraint, the DEA model will be the CCR model where farms are assumed to be
operating at their optimal scale.
We calculate the efficiency values of both the CRS and the VRS specifications and
compare them to analyze the scale efficiencies of the sample farms. The VRS model
allows calculating technical efficiency (TE) without the scale efficiency (SE) effects,
which means that the CRS technical efficiency is decomposed into pure technical
efficiency and SE. The scale efficiency is given by the ratio TE CRS /TE VRS (Coelli
et al. 2005). If the scale efficiency is equal to one, it suggests that the farm is operating
at the optimal scale. Any changes in the scale results in inefficiency that may exist
either due to increasing returns to scale (IRS) or decreasing returns to scale (DRS).
As a second stage of this study, we select several explanatory variables that are
expected to be potential determinants of technical efficiency. The model of technical
efficiency could be specified as follows:
TE i = β 0 +
J
j=1
β j Z ji + μ i
(3)
where Z j (j = 1, 2, …, J) is the farm-specific variables that may affect technical
efficiency, β i is an unknown parameter to be estimated, μ i represents the error term.
As for the variable Z h , we include the ratio of cultivation of crops, years of education,
sex, age of the head of household, ratio of family labor to total labor. We use the
ordinary least squares (OLS) regression for the estimation of the parameters of the
model in Eq. (3). To examine the effect of crop diversification on technical efficiency,
we use the Simpson index of diversification (SID), which is mathematically defined
as:
S I D i = 1 −
n
h
P
2
hi
(4)
where P hi is the proportionate area of hth crop to the total cropping area for the ith
farm household. This index ranges between 0 and 1. If this index closer to one, farmers
adopt higher diversification. The value closer to 0 indicates more specialization.