

174
E. Iwasaki and K. Kashiwagi
Regarding the scale efficiency, our empirical results show that 51.3% of the
sample farms were scale efficient. The percentage of agricultural households that
had decreasing returns to scale was 24.1%, whereas 24.6% of them experienced
increasing returns to scale. These results suggest that 24.6% of farms could possibly
increase their production and productivity through increasing their inputs. About
24.1% of farms could improve productivity through reducing their use of inputs.
Regarding the second-stage analysis for Eq. (3), the method of the estimation used
was OLS regression. The estimated parameters and their robust standard errors are
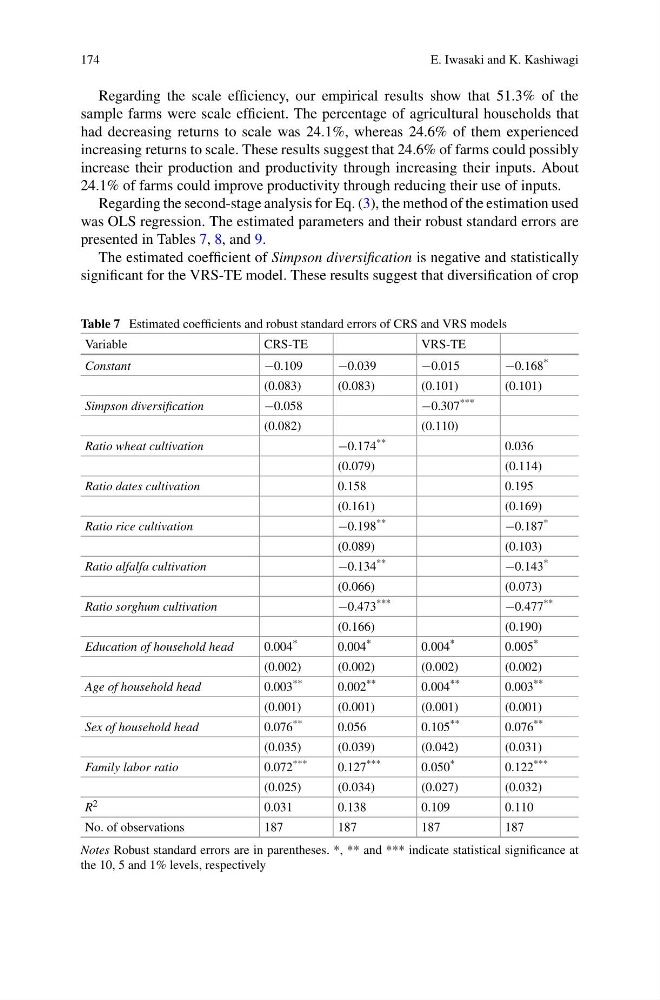
presented in Tables 7, 8, and 9.
The estimated coefficient of Simpson diversification is negative and statistically
significant for the VRS-TE model. These results suggest that diversification of crop
Table 7 Estimated coefficients and robust standard errors of CRS and VRS models
Variable
CRS-TE
VRS-TE
Constant
−0.109
−0.039
−0.015
−0.168 *
(0.083)
(0.083)
(0.101)
(0.101)
Simpson diversification
−0.058
−0.307 ***
(0.082)
(0.110)
Ratio wheat cultivation
−0.174 **
0.036
(0.079)
(0.114)
Ratio dates cultivation
0.158
0.195
(0.161)
(0.169)
Ratio rice cultivation
−0.198 **
−0.187 *
(0.089)
(0.103)
Ratio alfalfa cultivation
−0.134 **
−0.143 *
(0.066)
(0.073)
Ratio sorghum cultivation
−0.473 ***
−0.477 **
(0.166)
(0.190)
Education of household head
0.004 *
0.004 *
0.004 *
0.005 *
(0.002)
(0.002)
(0.002)
(0.002)
Age of household head
0.003 **
0.002 **
0.004 **
0.003 **
(0.001)
(0.001)
(0.001)
(0.001)
Sex of household head
0.076 **
0.056
0.105 **
0.076 **
(0.035)
(0.039)
(0.042)
(0.031)
Family labor ratio
0.072 ***
0.127 ***
0.050 *
0.122 ***
(0.025)
(0.034)
(0.027)
(0.032)
R 2
0.031
0.138
0.109
0.110
No. of observations
187
187
187
187
Notes Robust standard errors are in parentheses. *, ** and *** indicate statistical significance at
the 10, 5 and 1% levels, respectively
E. Iwasaki and K. Kashiwagi
Regarding the scale efficiency, our empirical results show that 51.3% of the
sample farms were scale efficient. The percentage of agricultural households that
had decreasing returns to scale was 24.1%, whereas 24.6% of them experienced
increasing returns to scale. These results suggest that 24.6% of farms could possibly
increase their production and productivity through increasing their inputs. About
24.1% of farms could improve productivity through reducing their use of inputs.
Regarding the second-stage analysis for Eq. (3), the method of the estimation used
was OLS regression. The estimated parameters and their robust standard errors are
presented in Tables 7, 8, and 9.
The estimated coefficient of Simpson diversification is negative and statistically
significant for the VRS-TE model. These results suggest that diversification of crop
Table 7 Estimated coefficients and robust standard errors of CRS and VRS models
Variable
CRS-TE
VRS-TE
Constant
−0.109
−0.039
−0.015
−0.168 *
(0.083)
(0.083)
(0.101)
(0.101)
Simpson diversification
−0.058
−0.307 ***
(0.082)
(0.110)
Ratio wheat cultivation
−0.174 **
0.036
(0.079)
(0.114)
Ratio dates cultivation
0.158
0.195
(0.161)
(0.169)
Ratio rice cultivation
−0.198 **
−0.187 *
(0.089)
(0.103)
Ratio alfalfa cultivation
−0.134 **
−0.143 *
(0.066)
(0.073)
Ratio sorghum cultivation
−0.473 ***
−0.477 **
(0.166)
(0.190)
Education of household head
0.004 *
0.004 *
0.004 *
0.005 *
(0.002)
(0.002)
(0.002)
(0.002)
Age of household head
0.003 **
0.002 **
0.004 **
0.003 **
(0.001)
(0.001)
(0.001)
(0.001)
Sex of household head
0.076 **
0.056
0.105 **
0.076 **
(0.035)
(0.039)
(0.042)
(0.031)
Family labor ratio
0.072 ***
0.127 ***
0.050 *
0.122 ***
(0.025)
(0.034)
(0.027)
(0.032)
R 2
0.031
0.138
0.109
0.110
No. of observations
187
187
187
187
Notes Robust standard errors are in parentheses. *, ** and *** indicate statistical significance at
the 10, 5 and 1% levels, respectively