

60
The implication of change in erosivity due to the current and future changes in
climate is presented in Tables 5.4 and 5.5, indicating variations in the potential
annual erosivity for the current climate and future scenarios. Figure 5.11 presents
the spatial variability of the projected rainfall erosivity and erosivity density for
Kazakhstan. In addition, Fig. 5.12 presents the relative difference between each projected scenario and the models’ baseline. The highest values occur in the East
Kazakhstan region, and the lowest values are in the Mangystau region for the
observed data and all models (Table 5.5).
5.4 Erosivity Density in Kazakhstan
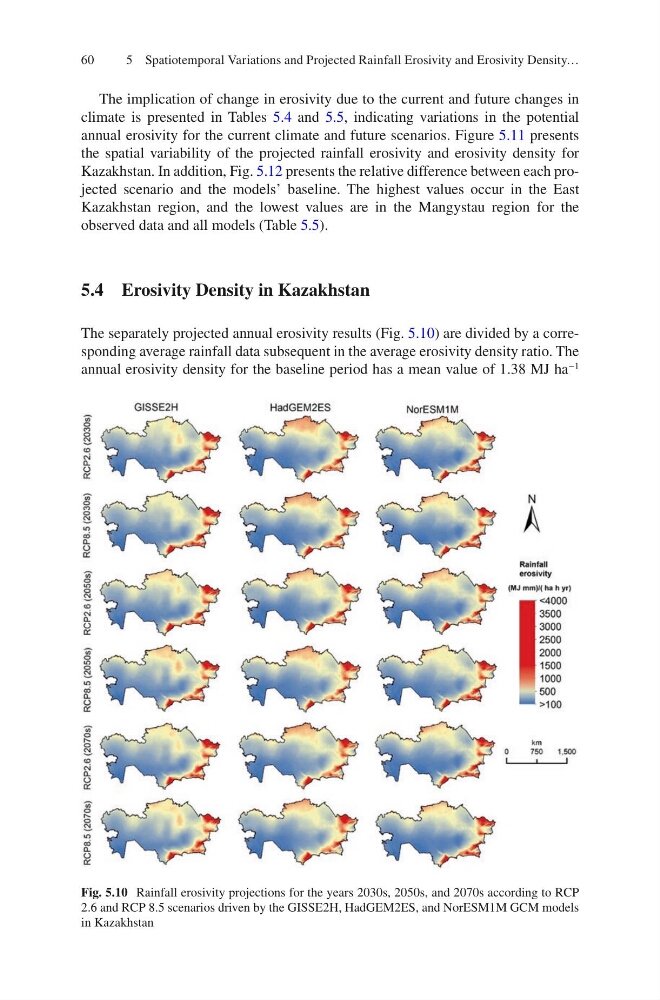
The separately projected annual erosivity results (Fig. 5.10) are divided by a corresponding average rainfall data subsequent in the average erosivity density ratio. The
annual erosivity density for the baseline period has a mean value of 1.38 MJ ha
−1
Fig. 5.10 Rainfall erosivity projections for the years 2030s, 2050s, and 2070s according to RCP
2.6 and RCP 8.5 scenarios driven by the GISSE2H, HadGEM2ES, and NorESM1M GCM models
in Kazakhstan
5 Spatiotemporal Variations and Projected Rainfall Erosivity and Erosivity Density…
The implication of change in erosivity due to the current and future changes in
climate is presented in Tables 5.4 and 5.5, indicating variations in the potential
annual erosivity for the current climate and future scenarios. Figure 5.11 presents
the spatial variability of the projected rainfall erosivity and erosivity density for
Kazakhstan. In addition, Fig. 5.12 presents the relative difference between each projected scenario and the models’ baseline. The highest values occur in the East
Kazakhstan region, and the lowest values are in the Mangystau region for the
observed data and all models (Table 5.5).
5.4 Erosivity Density in Kazakhstan
The separately projected annual erosivity results (Fig. 5.10) are divided by a corresponding average rainfall data subsequent in the average erosivity density ratio. The
annual erosivity density for the baseline period has a mean value of 1.38 MJ ha
−1
Fig. 5.10 Rainfall erosivity projections for the years 2030s, 2050s, and 2070s according to RCP
2.6 and RCP 8.5 scenarios driven by the GISSE2H, HadGEM2ES, and NorESM1M GCM models
in Kazakhstan
5 Spatiotemporal Variations and Projected Rainfall Erosivity and Erosivity Density…