

61
h
−1
, with variability ranging from 0.62 to 3.69 MJ ha
−1
h
−1
. The projected variability
of erosivity density is also very high, as the HadGEM2ES-2.6 has the highest mean
erosivity densities of 1.61, 1.55, and 1.63 MJ ha
−1
h
−1
in the 2030s, 2050s, and
2070s, respectively, followed by GISSE2H-2.6 with erosivity densities of 1.57,
1.56, and 1.56 MJ ha
−1
h
−1
in the 2030s, 2050s, and 2070s, respectively. The erosivity densities of BCCCSM1.1-2.6 and BCCCSM1.1-8.5 are 1.45 and 1.43 in the
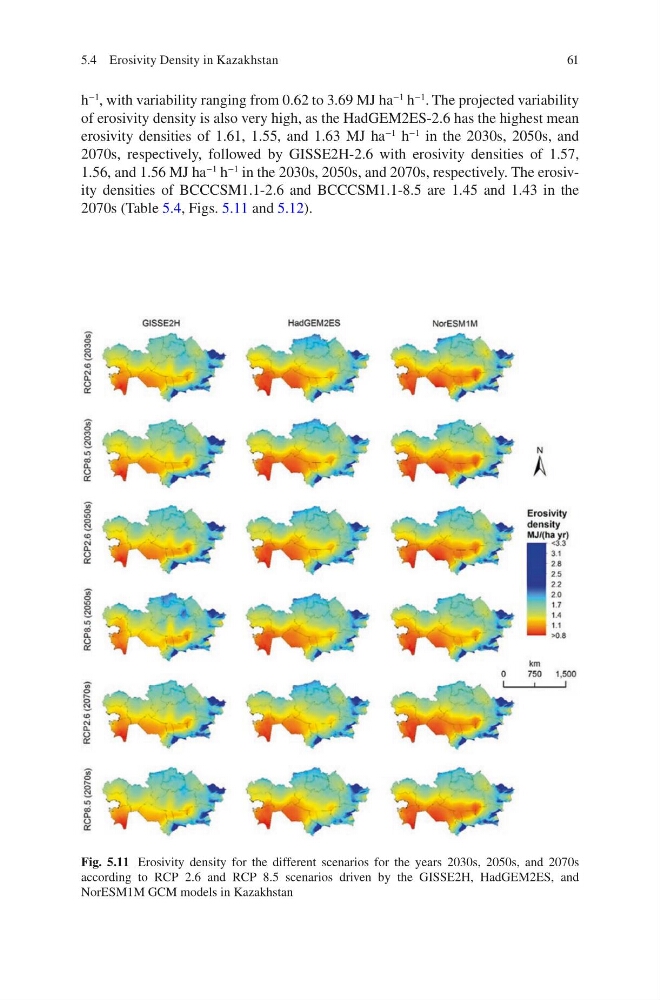
2070s (Table 5.4, Figs. 5.11 and 5.12).
Fig. 5.11 Erosivity density for the different scenarios for the years 2030s, 2050s, and 2070s
according to RCP 2.6 and RCP 8.5 scenarios driven by the GISSE2H, HadGEM2ES, and
NorESM1M GCM models in Kazakhstan
5.4 Erosivity Density in Kazakhstan
h
−1
, with variability ranging from 0.62 to 3.69 MJ ha
−1
h
−1
. The projected variability
of erosivity density is also very high, as the HadGEM2ES-2.6 has the highest mean
erosivity densities of 1.61, 1.55, and 1.63 MJ ha
−1
h
−1
in the 2030s, 2050s, and
2070s, respectively, followed by GISSE2H-2.6 with erosivity densities of 1.57,
1.56, and 1.56 MJ ha
−1
h
−1
in the 2030s, 2050s, and 2070s, respectively. The erosivity densities of BCCCSM1.1-2.6 and BCCCSM1.1-8.5 are 1.45 and 1.43 in the
2070s (Table 5.4, Figs. 5.11 and 5.12).
Fig. 5.11 Erosivity density for the different scenarios for the years 2030s, 2050s, and 2070s
according to RCP 2.6 and RCP 8.5 scenarios driven by the GISSE2H, HadGEM2ES, and
NorESM1M GCM models in Kazakhstan
5.4 Erosivity Density in Kazakhstan