

57
instead, the trend is synonymous with that in the average annual precipitation.
Spatially, for all GCMs and baseline climate, rainfall erosivity is higher to the east
of the country but lower to the west.
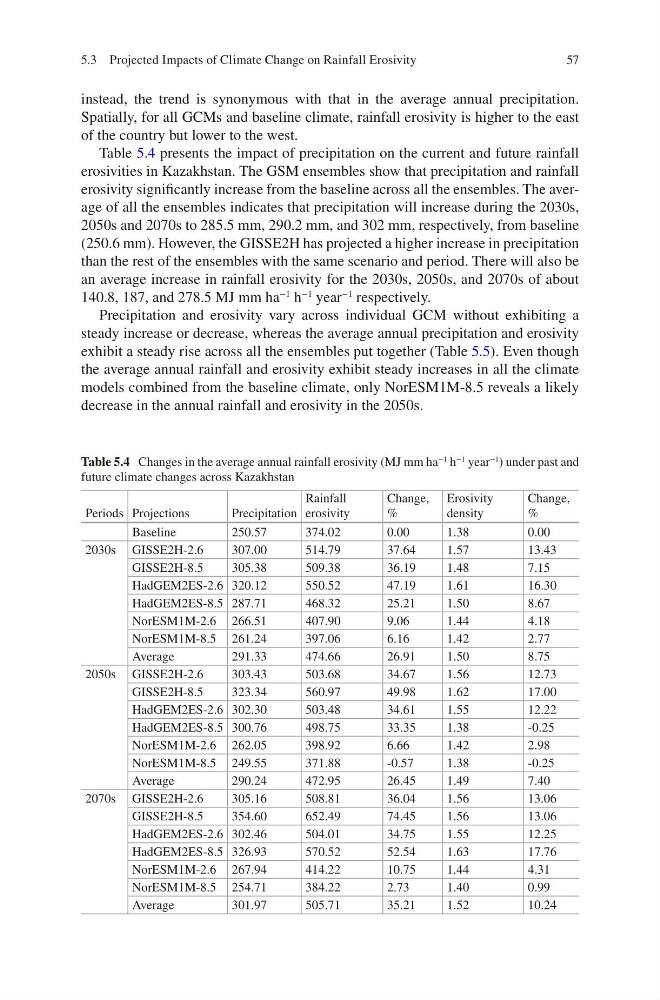
Table 5.4 presents the impact of precipitation on the current and future rainfall
erosivities in Kazakhstan. The GSM ensembles show that precipitation and rainfall
erosivity significantly increase from the baseline across all the ensembles. The average of all the ensembles indicates that precipitation will increase during the 2030s,
2050s and 2070s to 285.5 mm, 290.2 mm, and 302 mm, respectively, from baseline
(250.6 mm). However, the GISSE2H has projected a higher increase in precipitation
than the rest of the ensembles with the same scenario and period. There will also be
an average increase in rainfall erosivity for the 2030s, 2050s, and 2070s of about
140.8, 187, and 278.5 MJ mm ha
−1
h
−1
year
−1
respectively.
Precipitation and erosivity vary across individual GCM without exhibiting a
steady increase or decrease, whereas the average annual precipitation and erosivity
exhibit a steady rise across all the ensembles put together (Table 5.5). Even though
the average annual rainfall and erosivity exhibit steady increases in all the climate
models combined from the baseline climate, only NorESM1M-8.5 reveals a likely
decrease in the annual rainfall and erosivity in the 2050s.
Table 5.4 Changes in the average annual rainfall erosivity (MJ mm ha
−1 h
−1 year
−1 ) under past and
future climate changes across Kazakhstan
Periods Projections
Precipitation
Rainfall
erosivity
Change,
%
Erosivity
density
Change,
%
Baseline
250.57
374.02
0.00
1.38
0.00
2030s GISSE2H-2.6
307.00
514.79
37.64
1.57
13.43
GISSE2H-8.5
305.38
509.38
36.19
1.48
7.15
HadGEM2ES-2.6 320.12
550.52
47.19
1.61
16.30
HadGEM2ES-8.5 287.71
468.32
25.21
1.50
8.67
NorESM1M-2.6 266.51
407.90
9.06
1.44
4.18
NorESM1M-8.5 261.24
397.06
6.16
1.42
2.77
Average
291.33
474.66
26.91
1.50
8.75
2050s GISSE2H-2.6
303.43
503.68
34.67
1.56
12.73
GISSE2H-8.5
323.34
560.97
49.98
1.62
17.00
HadGEM2ES-2.6 302.30
503.48
34.61
1.55
12.22
HadGEM2ES-8.5 300.76
498.75
33.35
1.38
-0.25
NorESM1M-2.6 262.05
398.92
6.66
1.42
2.98
NorESM1M-8.5 249.55
371.88
-0.57
1.38
-0.25
Average
290.24
472.95
26.45
1.49
7.40
2070s GISSE2H-2.6
305.16
508.81
36.04
1.56
13.06
GISSE2H-8.5
354.60
652.49
74.45
1.56
13.06
HadGEM2ES-2.6 302.46
504.01
34.75
1.55
12.25
HadGEM2ES-8.5 326.93
570.52
52.54
1.63
17.76
NorESM1M-2.6 267.94
414.22
10.75
1.44
4.31
NorESM1M-8.5 254.71
384.22
2.73
1.40
0.99
Average
301.97
505.71
35.21
1.52
10.24
5.3 Projected Impacts of Climate Change on Rainfall Erosivity
instead, the trend is synonymous with that in the average annual precipitation.
Spatially, for all GCMs and baseline climate, rainfall erosivity is higher to the east
of the country but lower to the west.
Table 5.4 presents the impact of precipitation on the current and future rainfall
erosivities in Kazakhstan. The GSM ensembles show that precipitation and rainfall
erosivity significantly increase from the baseline across all the ensembles. The average of all the ensembles indicates that precipitation will increase during the 2030s,
2050s and 2070s to 285.5 mm, 290.2 mm, and 302 mm, respectively, from baseline
(250.6 mm). However, the GISSE2H has projected a higher increase in precipitation
than the rest of the ensembles with the same scenario and period. There will also be
an average increase in rainfall erosivity for the 2030s, 2050s, and 2070s of about
140.8, 187, and 278.5 MJ mm ha
−1
h
−1
year
−1
respectively.
Precipitation and erosivity vary across individual GCM without exhibiting a
steady increase or decrease, whereas the average annual precipitation and erosivity
exhibit a steady rise across all the ensembles put together (Table 5.5). Even though
the average annual rainfall and erosivity exhibit steady increases in all the climate
models combined from the baseline climate, only NorESM1M-8.5 reveals a likely
decrease in the annual rainfall and erosivity in the 2050s.
Table 5.4 Changes in the average annual rainfall erosivity (MJ mm ha
−1 h
−1 year
−1 ) under past and
future climate changes across Kazakhstan
Periods Projections
Precipitation
Rainfall
erosivity
Change,
%
Erosivity
density
Change,
%
Baseline
250.57
374.02
0.00
1.38
0.00
2030s GISSE2H-2.6
307.00
514.79
37.64
1.57
13.43
GISSE2H-8.5
305.38
509.38
36.19
1.48
7.15
HadGEM2ES-2.6 320.12
550.52
47.19
1.61
16.30
HadGEM2ES-8.5 287.71
468.32
25.21
1.50
8.67
NorESM1M-2.6 266.51
407.90
9.06
1.44
4.18
NorESM1M-8.5 261.24
397.06
6.16
1.42
2.77
Average
291.33
474.66
26.91
1.50
8.75
2050s GISSE2H-2.6
303.43
503.68
34.67
1.56
12.73
GISSE2H-8.5
323.34
560.97
49.98
1.62
17.00
HadGEM2ES-2.6 302.30
503.48
34.61
1.55
12.22
HadGEM2ES-8.5 300.76
498.75
33.35
1.38
-0.25
NorESM1M-2.6 262.05
398.92
6.66
1.42
2.98
NorESM1M-8.5 249.55
371.88
-0.57
1.38
-0.25
Average
290.24
472.95
26.45
1.49
7.40
2070s GISSE2H-2.6
305.16
508.81
36.04
1.56
13.06
GISSE2H-8.5
354.60
652.49
74.45
1.56
13.06
HadGEM2ES-2.6 302.46
504.01
34.75
1.55
12.25
HadGEM2ES-8.5 326.93
570.52
52.54
1.63
17.76
NorESM1M-2.6 267.94
414.22
10.75
1.44
4.31
NorESM1M-8.5 254.71
384.22
2.73
1.40
0.99
Average
301.97
505.71
35.21
1.52
10.24
5.3 Projected Impacts of Climate Change on Rainfall Erosivity