

4 Classifying the Forest Surfaces in Metropolitan Areas …
67
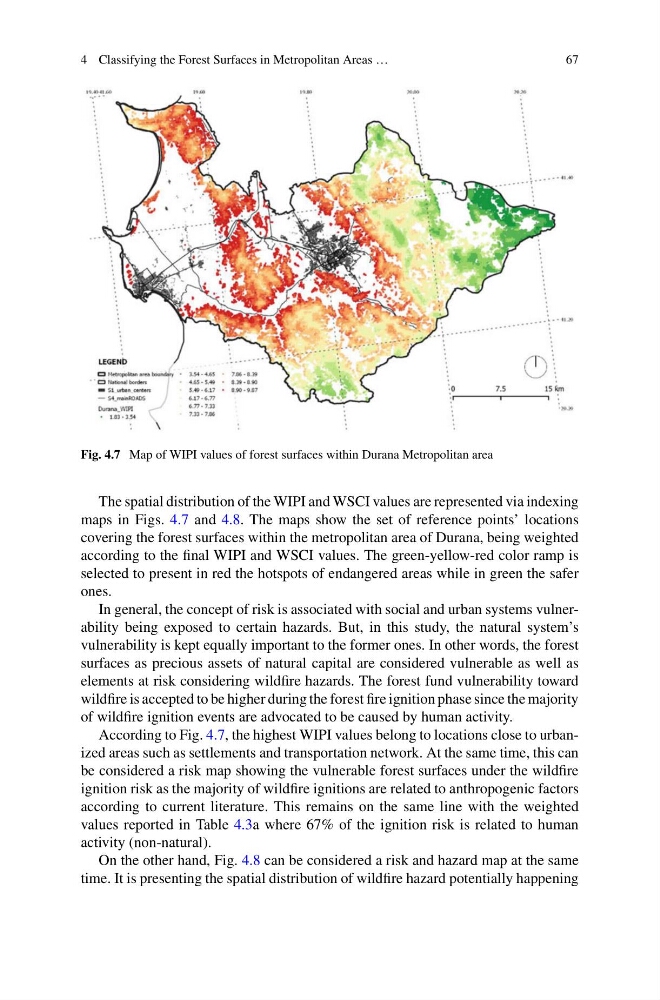
Fig. 4.7 Map of WIPI values of forest surfaces within Durana Metropolitan area
The spatial distribution of the WIPI and WSCI values are represented via indexing
maps in Figs. 4.7 and 4.8. The maps show the set of reference points’ locations
covering the forest surfaces within the metropolitan area of Durana, being weighted
according to the final WIPI and WSCI values. The green-yellow-red color ramp is
selected to present in red the hotspots of endangered areas while in green the safer
ones.
In general, the concept of risk is associated with social and urban systems vulnerability being exposed to certain hazards. But, in this study, the natural system’s
vulnerability is kept equally important to the former ones. In other words, the forest
surfaces as precious assets of natural capital are considered vulnerable as well as
elements at risk considering wildfire hazards. The forest fund vulnerability toward
wildfire is accepted to be higher during the forest fire ignition phase since the majority
of wildfire ignition events are advocated to be caused by human activity.
According to Fig. 4.7, the highest WIPI values belong to locations close to urbanized areas such as settlements and transportation network. At the same time, this can
be considered a risk map showing the vulnerable forest surfaces under the wildfire
ignition risk as the majority of wildfire ignitions are related to anthropogenic factors
according to current literature. This remains on the same line with the weighted
values reported in Table 4.3a where 67% of the ignition risk is related to human
activity (non-natural).
On the other hand, Fig. 4.8 can be considered a risk and hazard map at the same
time. It is presenting the spatial distribution of wildfire hazard potentially happening
67
Fig. 4.7 Map of WIPI values of forest surfaces within Durana Metropolitan area
The spatial distribution of the WIPI and WSCI values are represented via indexing
maps in Figs. 4.7 and 4.8. The maps show the set of reference points’ locations
covering the forest surfaces within the metropolitan area of Durana, being weighted
according to the final WIPI and WSCI values. The green-yellow-red color ramp is
selected to present in red the hotspots of endangered areas while in green the safer
ones.
In general, the concept of risk is associated with social and urban systems vulnerability being exposed to certain hazards. But, in this study, the natural system’s
vulnerability is kept equally important to the former ones. In other words, the forest
surfaces as precious assets of natural capital are considered vulnerable as well as
elements at risk considering wildfire hazards. The forest fund vulnerability toward
wildfire is accepted to be higher during the forest fire ignition phase since the majority
of wildfire ignition events are advocated to be caused by human activity.
According to Fig. 4.7, the highest WIPI values belong to locations close to urbanized areas such as settlements and transportation network. At the same time, this can
be considered a risk map showing the vulnerable forest surfaces under the wildfire
ignition risk as the majority of wildfire ignitions are related to anthropogenic factors
according to current literature. This remains on the same line with the weighted
values reported in Table 4.3a where 67% of the ignition risk is related to human
activity (non-natural).
On the other hand, Fig. 4.8 can be considered a risk and hazard map at the same
time. It is presenting the spatial distribution of wildfire hazard potentially happening