

66
A. Hysa
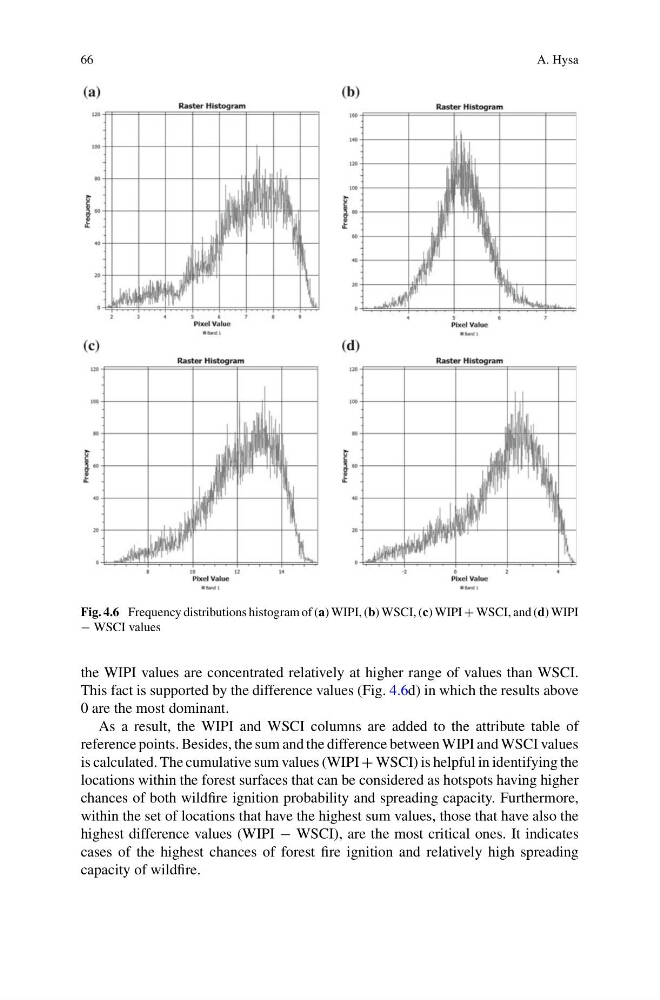
Fig. 4.6 Frequency distributions histogram of (a) WIPI, (b) WSCI, (c) WIPI + WSCI, and (d) WIPI
− WSCI values
the WIPI values are concentrated relatively at higher range of values than WSCI.
This fact is supported by the difference values (Fig. 4.6d) in which the results above
0 are the most dominant.
As a result, the WIPI and WSCI columns are added to the attribute table of
reference points. Besides, the sum and the difference between WIPI and WSCI values
is calculated. The cumulative sum values (WIPI + WSCI) is helpful in identifying the
locations within the forest surfaces that can be considered as hotspots having higher
chances of both wildfire ignition probability and spreading capacity. Furthermore,
within the set of locations that have the highest sum values, those that have also the
highest difference values (WIPI − WSCI), are the most critical ones. It indicates
cases of the highest chances of forest fire ignition and relatively high spreading
capacity of wildfire.
A. Hysa
Fig. 4.6 Frequency distributions histogram of (a) WIPI, (b) WSCI, (c) WIPI + WSCI, and (d) WIPI
− WSCI values
the WIPI values are concentrated relatively at higher range of values than WSCI.
This fact is supported by the difference values (Fig. 4.6d) in which the results above
0 are the most dominant.
As a result, the WIPI and WSCI columns are added to the attribute table of
reference points. Besides, the sum and the difference between WIPI and WSCI values
is calculated. The cumulative sum values (WIPI + WSCI) is helpful in identifying the
locations within the forest surfaces that can be considered as hotspots having higher
chances of both wildfire ignition probability and spreading capacity. Furthermore,
within the set of locations that have the highest sum values, those that have also the
highest difference values (WIPI − WSCI), are the most critical ones. It indicates
cases of the highest chances of forest fire ignition and relatively high spreading
capacity of wildfire.