

44
Md. A. Sattar and K. K. W. Cheung
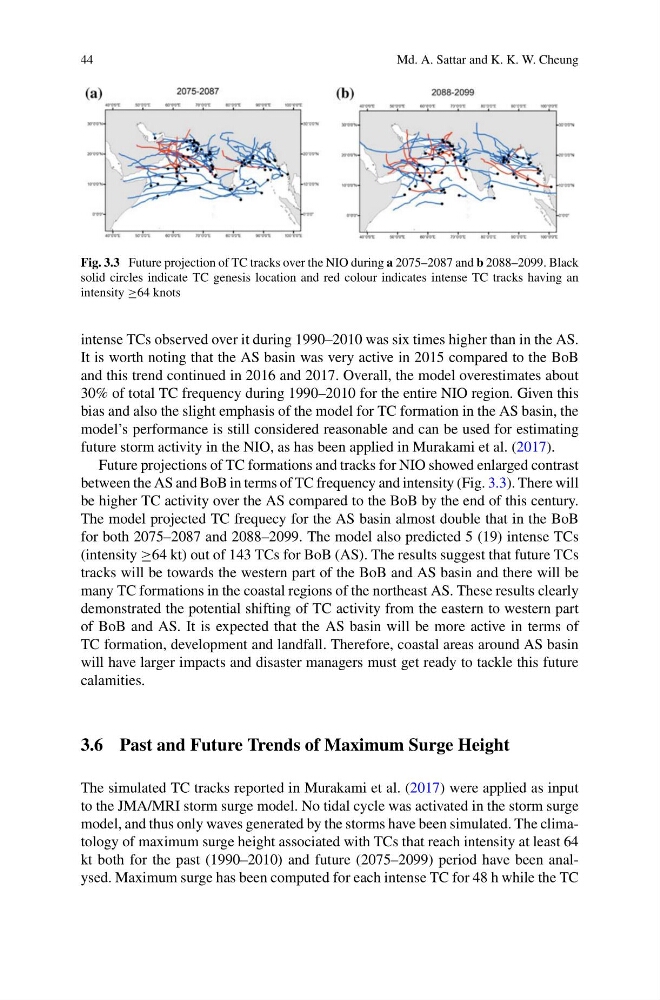
Fig. 3.3 Future projection of TC tracks over the NIO during a 2075–2087 and b 2088–2099. Black
solid circles indicate TC genesis location and red colour indicates intense TC tracks having an
intensity ≥64 knots
intense TCs observed over it during 1990–2010 was six times higher than in the AS.
It is worth noting that the AS basin was very active in 2015 compared to the BoB
and this trend continued in 2016 and 2017. Overall, the model overestimates about
30% of total TC frequency during 1990–2010 for the entire NIO region. Given this
bias and also the slight emphasis of the model for TC formation in the AS basin, the
model’s performance is still considered reasonable and can be used for estimating
future storm activity in the NIO, as has been applied in Murakami et al. (2017).
Future projections of TC formations and tracks for NIO showed enlarged contrast
between the AS and BoB in terms of TC frequency and intensity (Fig. 3.3). There will
be higher TC activity over the AS compared to the BoB by the end of this century.
The model projected TC frequecy for the AS basin almost double that in the BoB
for both 2075–2087 and 2088–2099. The model also predicted 5 (19) intense TCs
(intensity ≥64 kt) out of 143 TCs for BoB (AS). The results suggest that future TCs
tracks will be towards the western part of the BoB and AS basin and there will be
many TC formations in the coastal regions of the northeast AS. These results clearly
demonstrated the potential shifting of TC activity from the eastern to western part
of BoB and AS. It is expected that the AS basin will be more active in terms of
TC formation, development and landfall. Therefore, coastal areas around AS basin
will have larger impacts and disaster managers must get ready to tackle this future
calamities.
3.6 Past and Future Trends of Maximum Surge Height
The simulated TC tracks reported in Murakami et al. (2017) were applied as input
to the JMA/MRI storm surge model. No tidal cycle was activated in the storm surge
model, and thus only waves generated by the storms have been simulated. The climatology of maximum surge height associated with TCs that reach intensity at least 64
kt both for the past (1990–2010) and future (2075–2099) period have been analysed. Maximum surge has been computed for each intense TC for 48 h while the TC
Md. A. Sattar and K. K. W. Cheung
Fig. 3.3 Future projection of TC tracks over the NIO during a 2075–2087 and b 2088–2099. Black
solid circles indicate TC genesis location and red colour indicates intense TC tracks having an
intensity ≥64 knots
intense TCs observed over it during 1990–2010 was six times higher than in the AS.
It is worth noting that the AS basin was very active in 2015 compared to the BoB
and this trend continued in 2016 and 2017. Overall, the model overestimates about
30% of total TC frequency during 1990–2010 for the entire NIO region. Given this
bias and also the slight emphasis of the model for TC formation in the AS basin, the
model’s performance is still considered reasonable and can be used for estimating
future storm activity in the NIO, as has been applied in Murakami et al. (2017).
Future projections of TC formations and tracks for NIO showed enlarged contrast
between the AS and BoB in terms of TC frequency and intensity (Fig. 3.3). There will
be higher TC activity over the AS compared to the BoB by the end of this century.
The model projected TC frequecy for the AS basin almost double that in the BoB
for both 2075–2087 and 2088–2099. The model also predicted 5 (19) intense TCs
(intensity ≥64 kt) out of 143 TCs for BoB (AS). The results suggest that future TCs
tracks will be towards the western part of the BoB and AS basin and there will be
many TC formations in the coastal regions of the northeast AS. These results clearly
demonstrated the potential shifting of TC activity from the eastern to western part
of BoB and AS. It is expected that the AS basin will be more active in terms of
TC formation, development and landfall. Therefore, coastal areas around AS basin
will have larger impacts and disaster managers must get ready to tackle this future
calamities.
3.6 Past and Future Trends of Maximum Surge Height
The simulated TC tracks reported in Murakami et al. (2017) were applied as input
to the JMA/MRI storm surge model. No tidal cycle was activated in the storm surge
model, and thus only waves generated by the storms have been simulated. The climatology of maximum surge height associated with TCs that reach intensity at least 64
kt both for the past (1990–2010) and future (2075–2099) period have been analysed. Maximum surge has been computed for each intense TC for 48 h while the TC