

3 Increasing Trends in Tropical Cyclone Induced Surge Impacts ...
45
approaches the coastal areas and makes landfall afterwards. During this period, the
TC will cause major damage and there is a great risk of surface inundation. The box
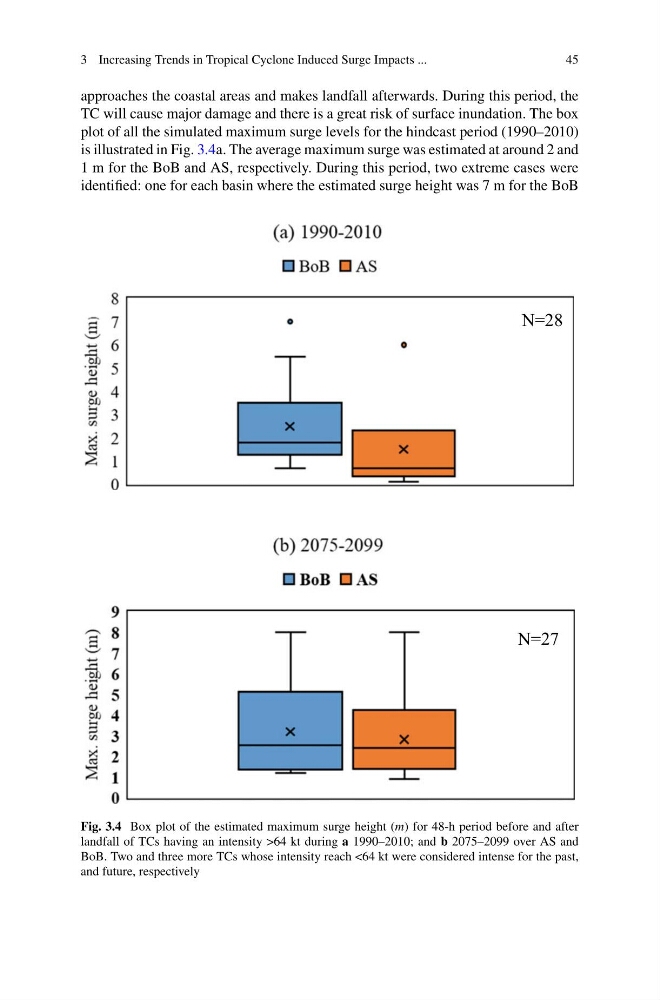
plot of all the simulated maximum surge levels for the hindcast period (1990–2010)
is illustrated in Fig. 3.4a. The average maximum surge was estimated at around 2 and
1 m for the BoB and AS, respectively. During this period, two extreme cases were
identified: one for each basin where the estimated surge height was 7 m for the BoB
N=28
N=27
Fig. 3.4 Box plot of the estimated maximum surge height (m) for 48-h period before and after
landfall of TCs having an intensity >64 kt during a 1990–2010; and b 2075–2099 over AS and
BoB. Two and three more TCs whose intensity reach <64 kt were considered intense for the past,
and future, respectively
45
approaches the coastal areas and makes landfall afterwards. During this period, the
TC will cause major damage and there is a great risk of surface inundation. The box
plot of all the simulated maximum surge levels for the hindcast period (1990–2010)
is illustrated in Fig. 3.4a. The average maximum surge was estimated at around 2 and
1 m for the BoB and AS, respectively. During this period, two extreme cases were
identified: one for each basin where the estimated surge height was 7 m for the BoB
N=28
N=27
Fig. 3.4 Box plot of the estimated maximum surge height (m) for 48-h period before and after
landfall of TCs having an intensity >64 kt during a 1990–2010; and b 2075–2099 over AS and
BoB. Two and three more TCs whose intensity reach <64 kt were considered intense for the past,
and future, respectively