

3 Increasing Trends in Tropical Cyclone Induced Surge Impacts ...
43
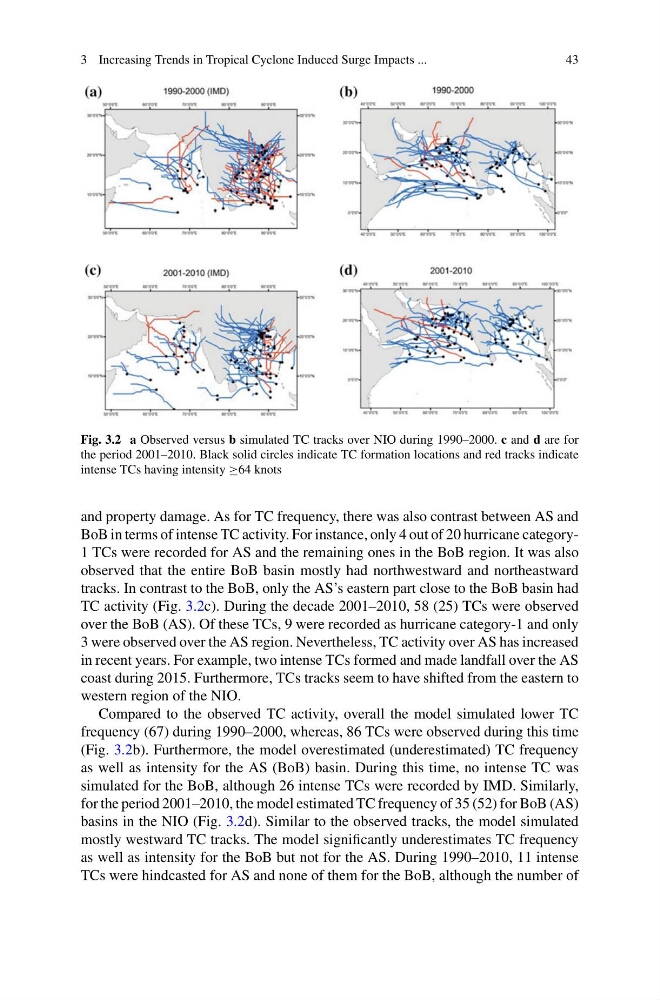
Fig. 3.2 a Observed versus b simulated TC tracks over NIO during 1990–2000. c and d are for
the period 2001–2010. Black solid circles indicate TC formation locations and red tracks indicate
intense TCs having intensity ≥64 knots
and property damage. As for TC frequency, there was also contrast between AS and
BoB in terms of intense TC activity. For instance, only 4 out of 20 hurricane category1 TCs were recorded for AS and the remaining ones in the BoB region. It was also
observed that the entire BoB basin mostly had northwestward and northeastward
tracks. In contrast to the BoB, only the AS’s eastern part close to the BoB basin had
TC activity (Fig. 3.2c). During the decade 2001–2010, 58 (25) TCs were observed
over the BoB (AS). Of these TCs, 9 were recorded as hurricane category-1 and only
3 were observed over the AS region. Nevertheless, TC activity over AS has increased
in recent years. For example, two intense TCs formed and made landfall over the AS
coast during 2015. Furthermore, TCs tracks seem to have shifted from the eastern to
western region of the NIO.
Compared to the observed TC activity, overall the model simulated lower TC
frequency (67) during 1990–2000, whereas, 86 TCs were observed during this time
(Fig. 3.2b). Furthermore, the model overestimated (underestimated) TC frequency
as well as intensity for the AS (BoB) basin. During this time, no intense TC was
simulated for the BoB, although 26 intense TCs were recorded by IMD. Similarly,
for the period 2001–2010, the model estimated TC frequency of 35 (52) for BoB (AS)
basins in the NIO (Fig. 3.2d). Similar to the observed tracks, the model simulated
mostly westward TC tracks. The model significantly underestimates TC frequency
as well as intensity for the BoB but not for the AS. During 1990–2010, 11 intense
TCs were hindcasted for AS and none of them for the BoB, although the number of
43
Fig. 3.2 a Observed versus b simulated TC tracks over NIO during 1990–2000. c and d are for
the period 2001–2010. Black solid circles indicate TC formation locations and red tracks indicate
intense TCs having intensity ≥64 knots
and property damage. As for TC frequency, there was also contrast between AS and
BoB in terms of intense TC activity. For instance, only 4 out of 20 hurricane category1 TCs were recorded for AS and the remaining ones in the BoB region. It was also
observed that the entire BoB basin mostly had northwestward and northeastward
tracks. In contrast to the BoB, only the AS’s eastern part close to the BoB basin had
TC activity (Fig. 3.2c). During the decade 2001–2010, 58 (25) TCs were observed
over the BoB (AS). Of these TCs, 9 were recorded as hurricane category-1 and only
3 were observed over the AS region. Nevertheless, TC activity over AS has increased
in recent years. For example, two intense TCs formed and made landfall over the AS
coast during 2015. Furthermore, TCs tracks seem to have shifted from the eastern to
western region of the NIO.
Compared to the observed TC activity, overall the model simulated lower TC
frequency (67) during 1990–2000, whereas, 86 TCs were observed during this time
(Fig. 3.2b). Furthermore, the model overestimated (underestimated) TC frequency
as well as intensity for the AS (BoB) basin. During this time, no intense TC was
simulated for the BoB, although 26 intense TCs were recorded by IMD. Similarly,
for the period 2001–2010, the model estimated TC frequency of 35 (52) for BoB (AS)
basins in the NIO (Fig. 3.2d). Similar to the observed tracks, the model simulated
mostly westward TC tracks. The model significantly underestimates TC frequency
as well as intensity for the BoB but not for the AS. During 1990–2010, 11 intense
TCs were hindcasted for AS and none of them for the BoB, although the number of