

42
Md. A. Sattar and K. K. W. Cheung
0
2
4
6
8
0
2
4
6
8
Modelled maximum surge level
(m)
Reported maximum surge level (m)
r = 0.69
p = 0.003 at 99% CL
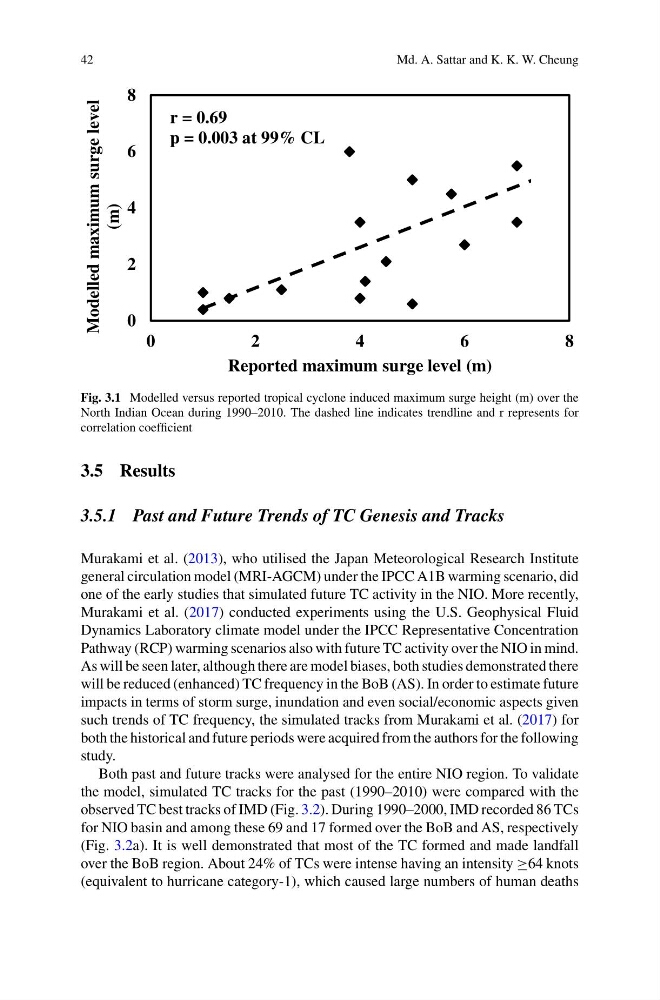
Fig. 3.1 Modelled versus reported tropical cyclone induced maximum surge height (m) over the
North Indian Ocean during 1990–2010. The dashed line indicates trendline and r represents for
correlation coefficient
3.5 Results
3.5.1 Past and Future Trends of TC Genesis and Tracks
Murakami et al. (2013), who utilised the Japan Meteorological Research Institute
general circulation model (MRI-AGCM) under the IPCC A1B warming scenario, did
one of the early studies that simulated future TC activity in the NIO. More recently,
Murakami et al. (2017) conducted experiments using the U.S. Geophysical Fluid
Dynamics Laboratory climate model under the IPCC Representative Concentration
Pathway (RCP) warming scenarios also with future TC activity over the NIO in mind.
As will be seen later, although there are model biases, both studies demonstrated there
will be reduced (enhanced) TC frequency in the BoB (AS). In order to estimate future
impacts in terms of storm surge, inundation and even social/economic aspects given
such trends of TC frequency, the simulated tracks from Murakami et al. (2017) for
both the historical and future periods were acquired from the authors for the following
study.
Both past and future tracks were analysed for the entire NIO region. To validate
the model, simulated TC tracks for the past (1990–2010) were compared with the
observed TC best tracks of IMD (Fig. 3.2). During 1990–2000, IMD recorded 86 TCs
for NIO basin and among these 69 and 17 formed over the BoB and AS, respectively
(Fig. 3.2a). It is well demonstrated that most of the TC formed and made landfall
over the BoB region. About 24% of TCs were intense having an intensity ≥64 knots
(equivalent to hurricane category-1), which caused large numbers of human deaths
Md. A. Sattar and K. K. W. Cheung
0
2
4
6
8
0
2
4
6
8
Modelled maximum surge level
(m)
Reported maximum surge level (m)
r = 0.69
p = 0.003 at 99% CL
Fig. 3.1 Modelled versus reported tropical cyclone induced maximum surge height (m) over the
North Indian Ocean during 1990–2010. The dashed line indicates trendline and r represents for
correlation coefficient
3.5 Results
3.5.1 Past and Future Trends of TC Genesis and Tracks
Murakami et al. (2013), who utilised the Japan Meteorological Research Institute
general circulation model (MRI-AGCM) under the IPCC A1B warming scenario, did
one of the early studies that simulated future TC activity in the NIO. More recently,
Murakami et al. (2017) conducted experiments using the U.S. Geophysical Fluid
Dynamics Laboratory climate model under the IPCC Representative Concentration
Pathway (RCP) warming scenarios also with future TC activity over the NIO in mind.
As will be seen later, although there are model biases, both studies demonstrated there
will be reduced (enhanced) TC frequency in the BoB (AS). In order to estimate future
impacts in terms of storm surge, inundation and even social/economic aspects given
such trends of TC frequency, the simulated tracks from Murakami et al. (2017) for
both the historical and future periods were acquired from the authors for the following
study.
Both past and future tracks were analysed for the entire NIO region. To validate
the model, simulated TC tracks for the past (1990–2010) were compared with the
observed TC best tracks of IMD (Fig. 3.2). During 1990–2000, IMD recorded 86 TCs
for NIO basin and among these 69 and 17 formed over the BoB and AS, respectively
(Fig. 3.2a). It is well demonstrated that most of the TC formed and made landfall
over the BoB region. About 24% of TCs were intense having an intensity ≥64 knots
(equivalent to hurricane category-1), which caused large numbers of human deaths