

350
S. Lindbergh and J. Radke
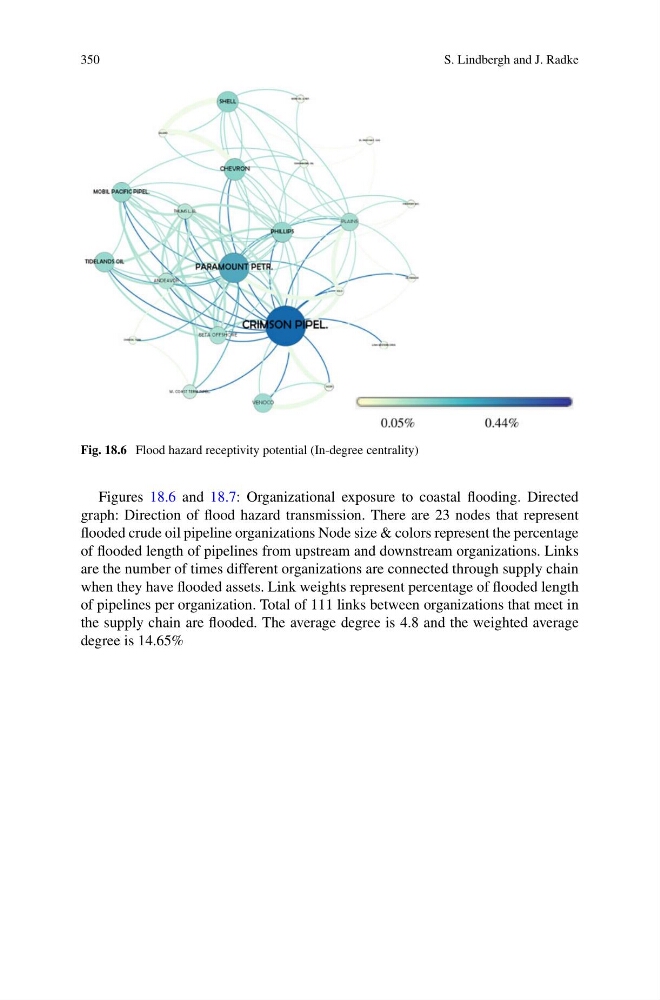
Fig. 18.6 Flood hazard receptivity potential (In-degree centrality)
Figures 18.6 and 18.7: Organizational exposure to coastal flooding. Directed
graph: Direction of flood hazard transmission. There are 23 nodes that represent
flooded crude oil pipeline organizations Node size & colors represent the percentage
of flooded length of pipelines from upstream and downstream organizations. Links
are the number of times different organizations are connected through supply chain
when they have flooded assets. Link weights represent percentage of flooded length
of pipelines per organization. Total of 111 links between organizations that meet in
the supply chain are flooded. The average degree is 4.8 and the weighted average
degree is 14.65%
S. Lindbergh and J. Radke
Fig. 18.6 Flood hazard receptivity potential (In-degree centrality)
Figures 18.6 and 18.7: Organizational exposure to coastal flooding. Directed
graph: Direction of flood hazard transmission. There are 23 nodes that represent
flooded crude oil pipeline organizations Node size & colors represent the percentage
of flooded length of pipelines from upstream and downstream organizations. Links
are the number of times different organizations are connected through supply chain
when they have flooded assets. Link weights represent percentage of flooded length
of pipelines per organization. Total of 111 links between organizations that meet in
the supply chain are flooded. The average degree is 4.8 and the weighted average
degree is 14.65%