

122
K. Shrestha et al.
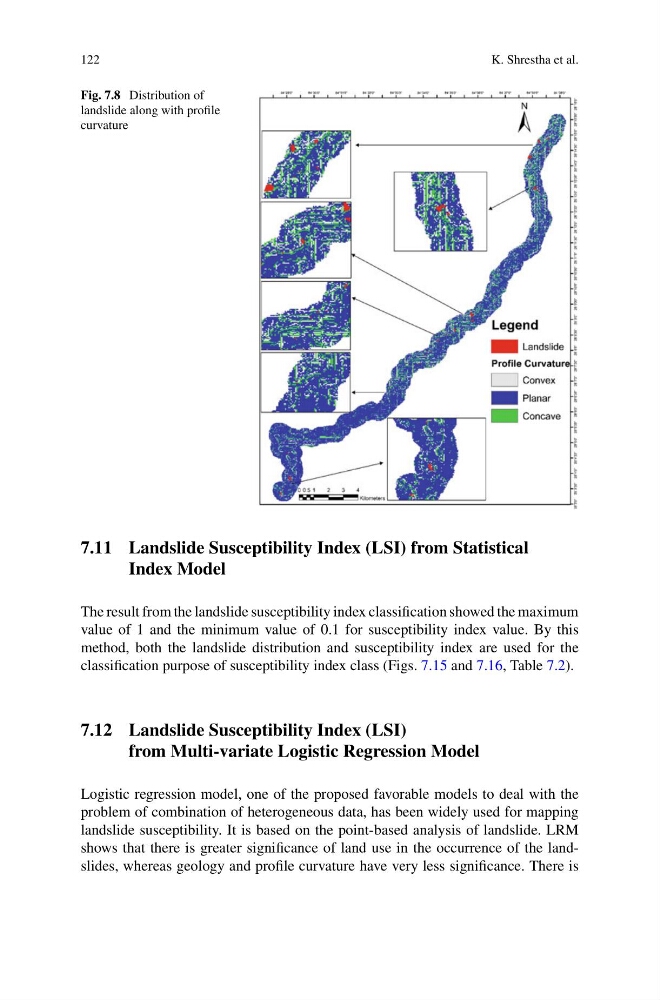
Fig. 7.8 Distribution of
landslide along with profile
curvature
7.11 Landslide Susceptibility Index (LSI) from Statistical
Index Model
The result from the landslide susceptibility index classification showed the maximum
value of 1 and the minimum value of 0.1 for susceptibility index value. By this
method, both the landslide distribution and susceptibility index are used for the
classification purpose of susceptibility index class (Figs. 7.15 and 7.16, Table 7.2).
7.12 Landslide Susceptibility Index (LSI)
from Multi-variate Logistic Regression Model
Logistic regression model, one of the proposed favorable models to deal with the
problem of combination of heterogeneous data, has been widely used for mapping
landslide susceptibility. It is based on the point-based analysis of landslide. LRM
shows that there is greater significance of land use in the occurrence of the landslides, whereas geology and profile curvature have very less significance. There is
K. Shrestha et al.
Fig. 7.8 Distribution of
landslide along with profile
curvature
7.11 Landslide Susceptibility Index (LSI) from Statistical
Index Model
The result from the landslide susceptibility index classification showed the maximum
value of 1 and the minimum value of 0.1 for susceptibility index value. By this
method, both the landslide distribution and susceptibility index are used for the
classification purpose of susceptibility index class (Figs. 7.15 and 7.16, Table 7.2).
7.12 Landslide Susceptibility Index (LSI)
from Multi-variate Logistic Regression Model
Logistic regression model, one of the proposed favorable models to deal with the
problem of combination of heterogeneous data, has been widely used for mapping
landslide susceptibility. It is based on the point-based analysis of landslide. LRM
shows that there is greater significance of land use in the occurrence of the landslides, whereas geology and profile curvature have very less significance. There is