

demographics portion of the survey-interviews. It should be noted here that although
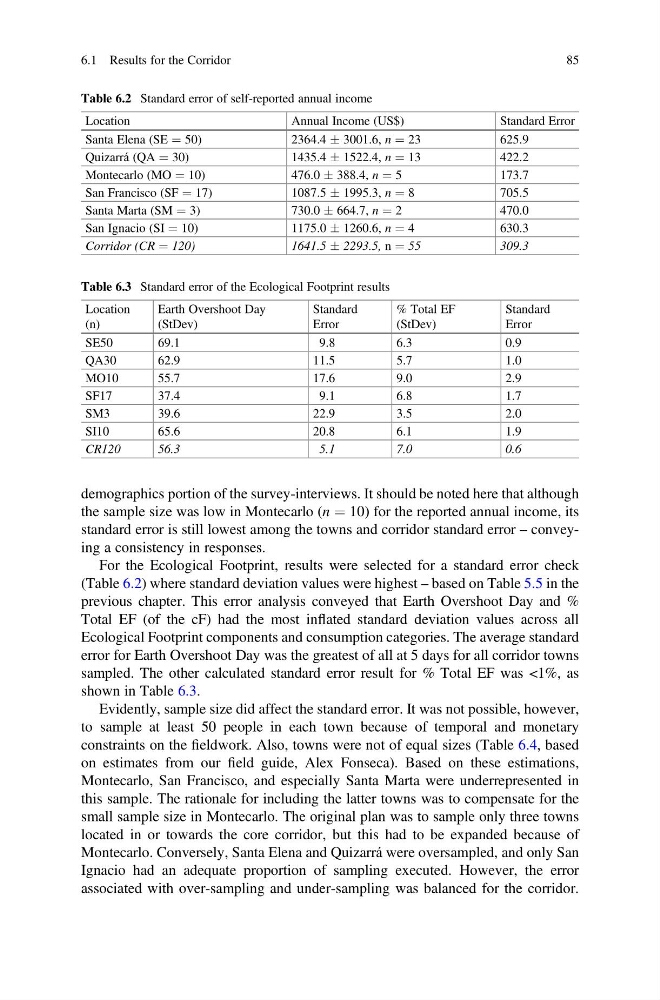
the sample size was low in Montecarlo (n ¼ 10) for the reported annual income, its
standard error is still lowest among the towns and corridor standard error – conveying a consistency in responses.
For the Ecological Footprint, results were selected for a standard error check
(Table 6.2) where standard deviation values were highest – based on Table 5.5 in the
previous chapter. This error analysis conveyed that Earth Overshoot Day and %
Total EF (of the cF) had the most inflated standard deviation values across all
Ecological Footprint components and consumption categories. The average standard
error for Earth Overshoot Day was the greatest of all at 5 days for all corridor towns
sampled. The other calculated standard error result for % Total EF was <1%, as
shown in Table 6.3.
Evidently, sample size did affect the standard error. It was not possible, however,
to sample at least 50 people in each town because of temporal and monetary
constraints on the fieldwork. Also, towns were not of equal sizes (Table 6.4, based
on estimates from our field guide, Alex Fonseca). Based on these estimations,
Montecarlo, San Francisco, and especially Santa Marta were underrepresented in
this sample. The rationale for including the latter towns was to compensate for the
small sample size in Montecarlo. The original plan was to sample only three towns
located in or towards the core corridor, but this had to be expanded because of
Montecarlo. Conversely, Santa Elena and Quizarrá were oversampled, and only San
Ignacio had an adequate proportion of sampling executed. However, the error
associated with over-sampling and under-sampling was balanced for the corridor.
Table 6.2 Standard error of self-reported annual income
Location
Annual Income (US$)
Standard Error
Santa Elena (SE ¼ 50)
2364.4 Æ 3001.6, n ¼ 23
625.9
Quizarrá (QA ¼ 30)
1435.4 Æ 1522.4, n ¼ 13
422.2
Montecarlo (MO ¼ 10)
476.0 Æ 388.4, n ¼ 5
173.7
San Francisco (SF ¼ 17)
1087.5 Æ 1995.3, n ¼ 8
705.5
Santa Marta (SM ¼ 3)
730.0 Æ 664.7, n ¼ 2
470.0
San Ignacio (SI ¼ 10)
1175.0 Æ 1260.6, n ¼ 4
630.3
Corridor (CR ¼ 120)
1641.5 Æ 2293.5, n ¼ 55
309.3
Table 6.3 Standard error of the Ecological Footprint results
Location
(n)
Earth Overshoot Day
(StDev)
Standard
Error
% Total EF
(StDev)
Standard
Error
SE50
69.1
9.8
6.3
0.9
QA30
62.9
11.5
5.7
1.0
MO10
55.7
17.6
9.0
2.9
SF17
37.4
9.1
6.8
1.7
SM3
39.6
22.9
3.5
2.0
SI10
65.6
20.8
6.1
1.9
CR120
56.3
5.1
7.0
0.6
6.1 Results for the Corridor
85
the sample size was low in Montecarlo (n ¼ 10) for the reported annual income, its
standard error is still lowest among the towns and corridor standard error – conveying a consistency in responses.
For the Ecological Footprint, results were selected for a standard error check
(Table 6.2) where standard deviation values were highest – based on Table 5.5 in the
previous chapter. This error analysis conveyed that Earth Overshoot Day and %
Total EF (of the cF) had the most inflated standard deviation values across all
Ecological Footprint components and consumption categories. The average standard
error for Earth Overshoot Day was the greatest of all at 5 days for all corridor towns
sampled. The other calculated standard error result for % Total EF was <1%, as
shown in Table 6.3.
Evidently, sample size did affect the standard error. It was not possible, however,
to sample at least 50 people in each town because of temporal and monetary
constraints on the fieldwork. Also, towns were not of equal sizes (Table 6.4, based
on estimates from our field guide, Alex Fonseca). Based on these estimations,
Montecarlo, San Francisco, and especially Santa Marta were underrepresented in
this sample. The rationale for including the latter towns was to compensate for the
small sample size in Montecarlo. The original plan was to sample only three towns
located in or towards the core corridor, but this had to be expanded because of
Montecarlo. Conversely, Santa Elena and Quizarrá were oversampled, and only San
Ignacio had an adequate proportion of sampling executed. However, the error
associated with over-sampling and under-sampling was balanced for the corridor.
Table 6.2 Standard error of self-reported annual income
Location
Annual Income (US$)
Standard Error
Santa Elena (SE ¼ 50)
2364.4 Æ 3001.6, n ¼ 23
625.9
Quizarrá (QA ¼ 30)
1435.4 Æ 1522.4, n ¼ 13
422.2
Montecarlo (MO ¼ 10)
476.0 Æ 388.4, n ¼ 5
173.7
San Francisco (SF ¼ 17)
1087.5 Æ 1995.3, n ¼ 8
705.5
Santa Marta (SM ¼ 3)
730.0 Æ 664.7, n ¼ 2
470.0
San Ignacio (SI ¼ 10)
1175.0 Æ 1260.6, n ¼ 4
630.3
Corridor (CR ¼ 120)
1641.5 Æ 2293.5, n ¼ 55
309.3
Table 6.3 Standard error of the Ecological Footprint results
Location
(n)
Earth Overshoot Day
(StDev)
Standard
Error
% Total EF
(StDev)
Standard
Error
SE50
69.1
9.8
6.3
0.9
QA30
62.9
11.5
5.7
1.0
MO10
55.7
17.6
9.0
2.9
SF17
37.4
9.1
6.8
1.7
SM3
39.6
22.9
3.5
2.0
SI10
65.6
20.8
6.1
1.9
CR120
56.3
5.1
7.0
0.6
6.1 Results for the Corridor
85