

Besides affecting the standard error, the small sample size, particularly in
Montecarlo, San Francisco, and especially Santa Marta caused problems for
performing parametric statistical testing (e.g., ANOVA) at town level, which
would require at least 30 samples.
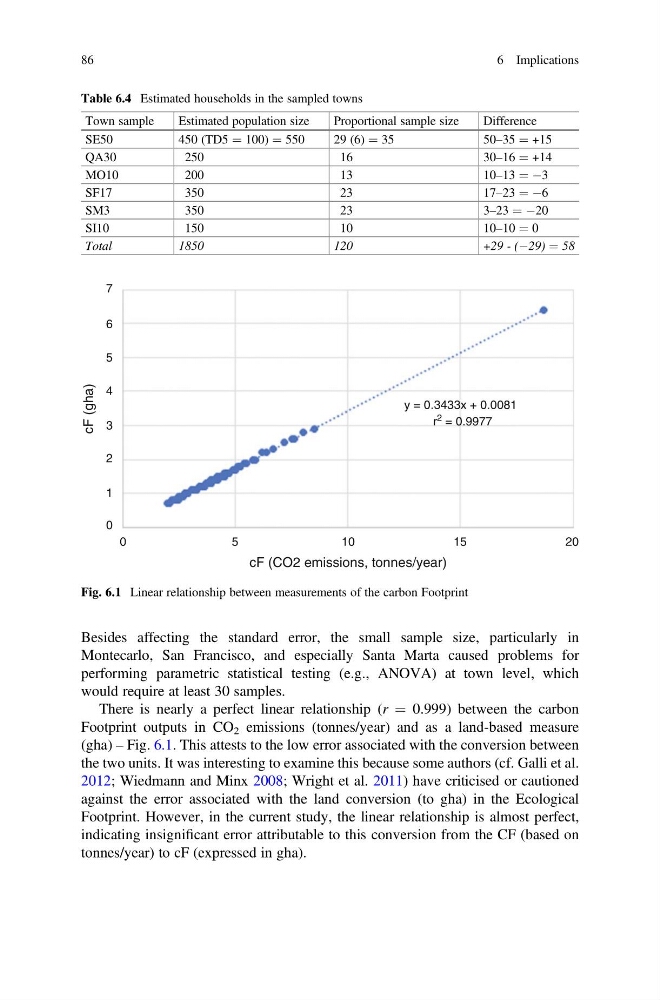
There is nearly a perfect linear relationship (r ¼ 0.999) between the carbon
Footprint outputs in CO 2 emissions (tonnes/year) and as a land-based measure
(gha) – Fig. 6.1. This attests to the low error associated with the conversion between
the two units. It was interesting to examine this because some authors (cf. Galli et al.
2012; Wiedmann and Minx 2008; Wright et al. 2011) have criticised or cautioned
against the error associated with the land conversion (to gha) in the Ecological
Footprint. However, in the current study, the linear relationship is almost perfect,
indicating insignificant error attributable to this conversion from the CF (based on
tonnes/year) to cF (expressed in gha).
Table 6.4 Estimated households in the sampled towns
Town sample
Estimated population size
Proportional sample size
Difference
SE50
450 (TD5 ¼ 100) ¼ 550
29 (6) ¼ 35
50–35 ¼ +15
QA30
250
16
30–16 ¼ +14
MO10
200
13
10–13 ¼ À3
SF17
350
23
17–23 ¼ À6
SM3
350
23
3–23 ¼ À20
SI10
150
10
10–10 ¼ 0
Total
1850
120
+29 - (À29) ¼ 58
7
6
5
4
3
2
1
0
0
5
cF (CO2 emissions, tonnes/year)
10
y = 0.3433x + 0.0081
r 2 = 0.9977
20
15
cF (gha)
Fig. 6.1 Linear relationship between measurements of the carbon Footprint
86
6 Implications
Montecarlo, San Francisco, and especially Santa Marta caused problems for
performing parametric statistical testing (e.g., ANOVA) at town level, which
would require at least 30 samples.
There is nearly a perfect linear relationship (r ¼ 0.999) between the carbon
Footprint outputs in CO 2 emissions (tonnes/year) and as a land-based measure
(gha) – Fig. 6.1. This attests to the low error associated with the conversion between
the two units. It was interesting to examine this because some authors (cf. Galli et al.
2012; Wiedmann and Minx 2008; Wright et al. 2011) have criticised or cautioned
against the error associated with the land conversion (to gha) in the Ecological
Footprint. However, in the current study, the linear relationship is almost perfect,
indicating insignificant error attributable to this conversion from the CF (based on
tonnes/year) to cF (expressed in gha).
Table 6.4 Estimated households in the sampled towns
Town sample
Estimated population size
Proportional sample size
Difference
SE50
450 (TD5 ¼ 100) ¼ 550
29 (6) ¼ 35
50–35 ¼ +15
QA30
250
16
30–16 ¼ +14
MO10
200
13
10–13 ¼ À3
SF17
350
23
17–23 ¼ À6
SM3
350
23
3–23 ¼ À20
SI10
150
10
10–10 ¼ 0
Total
1850
120
+29 - (À29) ¼ 58
7
6
5
4
3
2
1
0
0
5
cF (CO2 emissions, tonnes/year)
10
y = 0.3433x + 0.0081
r 2 = 0.9977
20
15
cF (gha)
Fig. 6.1 Linear relationship between measurements of the carbon Footprint
86
6 Implications