

6.1.1 Error Analysis
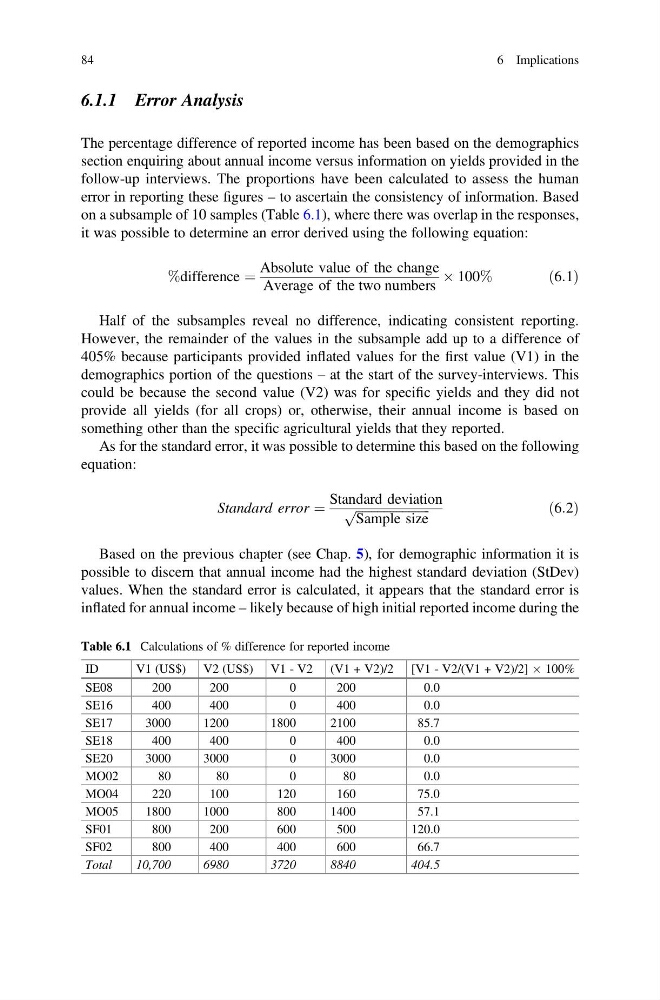
The percentage difference of reported income has been based on the demographics
section enquiring about annual income versus information on yields provided in the
follow-up interviews. The proportions have been calculated to assess the human
error in reporting these figures – to ascertain the consistency of information. Based
on a subsample of 10 samples (Table 6.1), where there was overlap in the responses,
it was possible to determine an error derived using the following equation:
%difference ¼
Absolute value of the change
Average of the two numbers
 100%
ð6:1Þ
Half of the subsamples reveal no difference, indicating consistent reporting.
However, the remainder of the values in the subsample add up to a difference of
405% because participants provided inflated values for the first value (V1) in the
demographics portion of the questions – at the start of the survey-interviews. This
could be because the second value (V2) was for specific yields and they did not
provide all yields (for all crops) or, otherwise, their annual income is based on
something other than the specific agricultural yields that they reported.
As for the standard error, it was possible to determine this based on the following
equation:
Standard error ¼
Standard deviation
ffiffiffiffiffiffiffiffiffiffiffiffiffiffiffiffiffiffiffiffiffiffiffi ffi
Sample size
p
ð6:2Þ
Based on the previous chapter (see Chap. 5), for demographic information it is
possible to discern that annual income had the highest standard deviation (StDev)
values. When the standard error is calculated, it appears that the standard error is
inflated for annual income – likely because of high initial reported income during the
Table 6.1 Calculations of % difference for reported income
ID
V1 (US$) V2 (US$) V1 - V2 (V1 + V2)/2 [V1 - V2/(V1 + V2)/2] Â 100%
SE08
200
200
0
200
0.0
SE16
400
400
0
400
0.0
SE17
3000
1200
1800
2100
85.7
SE18
400
400
0
400
0.0
SE20
3000
3000
0
3000
0.0
MO02
80
80
0
80
0.0
MO04
220
100
120
160
75.0
MO05
1800
1000
800
1400
57.1
SF01
800
200
600
500
120.0
SF02
800
400
400
600
66.7
Total
10,700
6980
3720
8840
404.5
84
6 Implications
The percentage difference of reported income has been based on the demographics
section enquiring about annual income versus information on yields provided in the
follow-up interviews. The proportions have been calculated to assess the human
error in reporting these figures – to ascertain the consistency of information. Based
on a subsample of 10 samples (Table 6.1), where there was overlap in the responses,
it was possible to determine an error derived using the following equation:
%difference ¼
Absolute value of the change
Average of the two numbers
 100%
ð6:1Þ
Half of the subsamples reveal no difference, indicating consistent reporting.
However, the remainder of the values in the subsample add up to a difference of
405% because participants provided inflated values for the first value (V1) in the
demographics portion of the questions – at the start of the survey-interviews. This
could be because the second value (V2) was for specific yields and they did not
provide all yields (for all crops) or, otherwise, their annual income is based on
something other than the specific agricultural yields that they reported.
As for the standard error, it was possible to determine this based on the following
equation:
Standard error ¼
Standard deviation
ffiffiffiffiffiffiffiffiffiffiffiffiffiffiffiffiffiffiffiffiffiffiffi ffi
Sample size
p
ð6:2Þ
Based on the previous chapter (see Chap. 5), for demographic information it is
possible to discern that annual income had the highest standard deviation (StDev)
values. When the standard error is calculated, it appears that the standard error is
inflated for annual income – likely because of high initial reported income during the
Table 6.1 Calculations of % difference for reported income
ID
V1 (US$) V2 (US$) V1 - V2 (V1 + V2)/2 [V1 - V2/(V1 + V2)/2] Â 100%
SE08
200
200
0
200
0.0
SE16
400
400
0
400
0.0
SE17
3000
1200
1800
2100
85.7
SE18
400
400
0
400
0.0
SE20
3000
3000
0
3000
0.0
MO02
80
80
0
80
0.0
MO04
220
100
120
160
75.0
MO05
1800
1000
800
1400
57.1
SF01
800
200
600
500
120.0
SF02
800
400
400
600
66.7
Total
10,700
6980
3720
8840
404.5
84
6 Implications