

the pollen of the evergreen broad-leaved trees that dominated
in the Holocene pollen group was rare and that the pollen of
deciduous broad-leaved trees was predominant. Moreover,
Sakaguchi and Okumura (1986) showed that the climate
during the last interglacial period (MIS 5e) was slightly colder
than the present climate (MIS1) in the eastern part of Hokkaido, Northern Japan, based on an analysis of pollen from
peat sediments from the last interglacial period.
In the last glacial period (MIS 4 to 2), the ice sheet expanded
not only in polar regions but also in the high- and midlatitude
regions of North America and Northern Europe, and the sea
level decreased by about 120–130 m in the last glacial maximum (MIS 2). As the sea level declined, the East China Sea
almost dried up and the Kuroshio Current flowed to the east on
the south side of the Ryukyu Islands. For this reason, the Sea of
Japan was in a state close to that of a lake, and the Japanese
Islands formed the edge of the east continent, a situation similar
to continental vegetation. In this period, coniferous trees of the
Pinaceae (pine family) dominated; forests with mixed deciduous broad-leaved trees were established in Honshu, and taiga
(boreal forest) of Larix gmelinii and Pinus pumila with grasslands spread in Hokkaido (Fig. 2.9). The altitude of the snow
line (the average position of the boundary between snow- or
ice-covered areas and areas not covered by snow or ice
throughout the year) declined, and mountain glaciers formed in
the central region of the Japanese Islands and the Hidaka
Mountains of Hokkaido (Figs. 2, 3 and 4: Iwata and Koaze,
2001). In this period, tree lines also greatly declined—in the
Chubu region to around 1000 to 1200 meters above sea level
and in Hokkaido to about 200 m or less above sea level
(Figs. 2.9 and 2.10)—and permafrost formed in the northern
and eastern part of the plains of Hokkaido (as determined on the
basis of fossil periglacial phenomena (Miura and Hirakawa
1995)). In areas above the tree line, grasslands and bare ground
spread, and in such places the movement of surface material
progressed via periglacial processes.
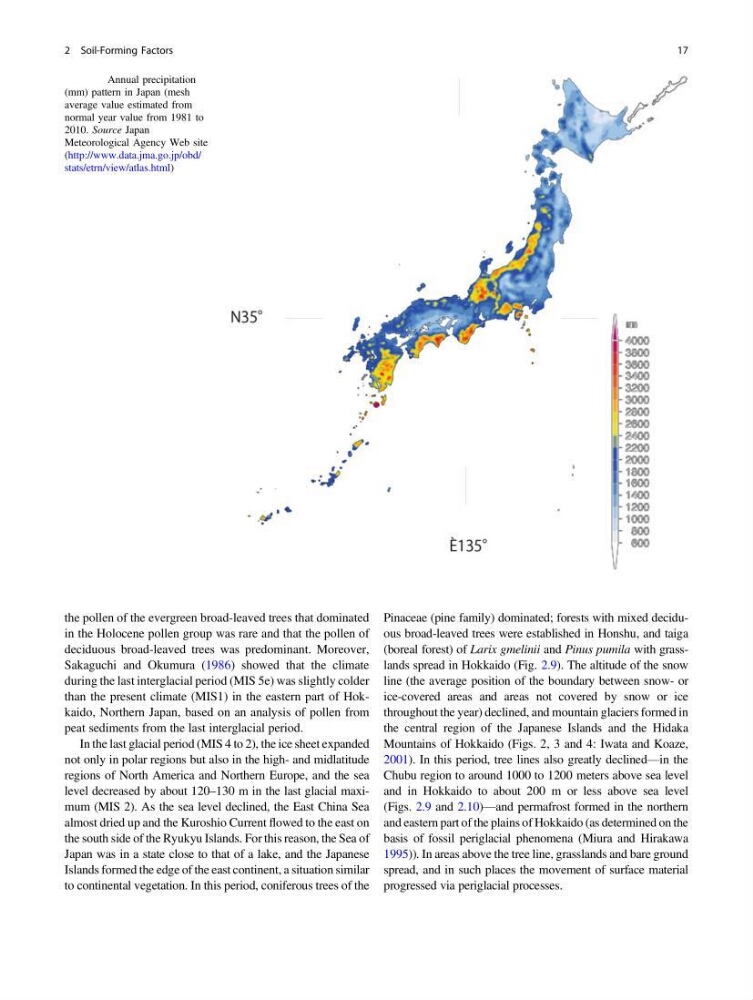
Fig. 2.4 Annual precipitation
(mm) pattern in Japan (mesh
average value estimated from
normal year value from 1981 to
2010. Source Japan
Meteorological Agency Web site
(http://www.data.jma.go.jp/obd/
stats/etrn/view/atlas.html)
2 Soil-Forming Factors
17
in the Holocene pollen group was rare and that the pollen of
deciduous broad-leaved trees was predominant. Moreover,
Sakaguchi and Okumura (1986) showed that the climate
during the last interglacial period (MIS 5e) was slightly colder
than the present climate (MIS1) in the eastern part of Hokkaido, Northern Japan, based on an analysis of pollen from
peat sediments from the last interglacial period.
In the last glacial period (MIS 4 to 2), the ice sheet expanded
not only in polar regions but also in the high- and midlatitude
regions of North America and Northern Europe, and the sea
level decreased by about 120–130 m in the last glacial maximum (MIS 2). As the sea level declined, the East China Sea
almost dried up and the Kuroshio Current flowed to the east on
the south side of the Ryukyu Islands. For this reason, the Sea of
Japan was in a state close to that of a lake, and the Japanese
Islands formed the edge of the east continent, a situation similar
to continental vegetation. In this period, coniferous trees of the
Pinaceae (pine family) dominated; forests with mixed deciduous broad-leaved trees were established in Honshu, and taiga
(boreal forest) of Larix gmelinii and Pinus pumila with grasslands spread in Hokkaido (Fig. 2.9). The altitude of the snow
line (the average position of the boundary between snow- or
ice-covered areas and areas not covered by snow or ice
throughout the year) declined, and mountain glaciers formed in
the central region of the Japanese Islands and the Hidaka
Mountains of Hokkaido (Figs. 2, 3 and 4: Iwata and Koaze,
2001). In this period, tree lines also greatly declined—in the
Chubu region to around 1000 to 1200 meters above sea level
and in Hokkaido to about 200 m or less above sea level
(Figs. 2.9 and 2.10)—and permafrost formed in the northern
and eastern part of the plains of Hokkaido (as determined on the
basis of fossil periglacial phenomena (Miura and Hirakawa
1995)). In areas above the tree line, grasslands and bare ground
spread, and in such places the movement of surface material
progressed via periglacial processes.
Fig. 2.4 Annual precipitation
(mm) pattern in Japan (mesh
average value estimated from
normal year value from 1981 to
2010. Source Japan
Meteorological Agency Web site
(http://www.data.jma.go.jp/obd/
stats/etrn/view/atlas.html)
2 Soil-Forming Factors
17