

It is important to know whether the climate of the last
interglacial period (MIS 5e) was milder than the current
interglacial period (MIS 1) in order to consider the history of
soil formation, such as that of relic red soils, and the shift of
past climate zones around the Japanese Islands. In general, the
distribution of plants is not determined by climatic conditions
alone, but the comparative study of two interglacial periods—
the last interglacial period (MIS 5e) and the current interglacial period (MIS (1)—using vegetation reconstruction
obtained from plant fossils would provide some insights into
climate conditions. In a study of pollen composition obtained
from marine sediment cores off Kashima in the Pacific Ocean
(MD 01-2421: 36° 01.40′ N, 141° 46.80′ E; water depth
2224 m; about 100 km off the east coast of the Honshu Island,
Central Japan), the temperature index value (Tp: pollen
temperature index) of pollen from the MIS 5e level was found
to be lower than that of pollen from the MIS 1 level (Igarashi
and Oba 2006). On the other hand, Okuda et al. (2010) applied
the modern analog method (calculation based on a data set of
seasonal changes in temperature and precipitation based on a
pollen fossil database: Nakagawa et al. 2002) to the analysis
of pollen from the Lake Biwa core (35° 13.28′ N, 136°00.63′
E; 1422 m deep from the lake bottom to the basement; central
part of Lake Biwa, the largest and oldest freshwater lake in
Japan, located in Western Honshu) and reported that the
average temperature of the MIS 5e level was not much different from that of the MIS 1 and MIS 11 levels, but that the
yearly difference in temperature was large. Additionally, Tsuji
et al. (1984) studied sediments from the last interglacial period
(MIS 5e) collected in the southern part of the Kanto region,
Central Japan, and reported that the fossils of seeds and fruits
of deciduous broad-leaved trees, which are now distributed in
the coastal region of southwestern Japan and the central and
southern parts of China, were present. They also reported that
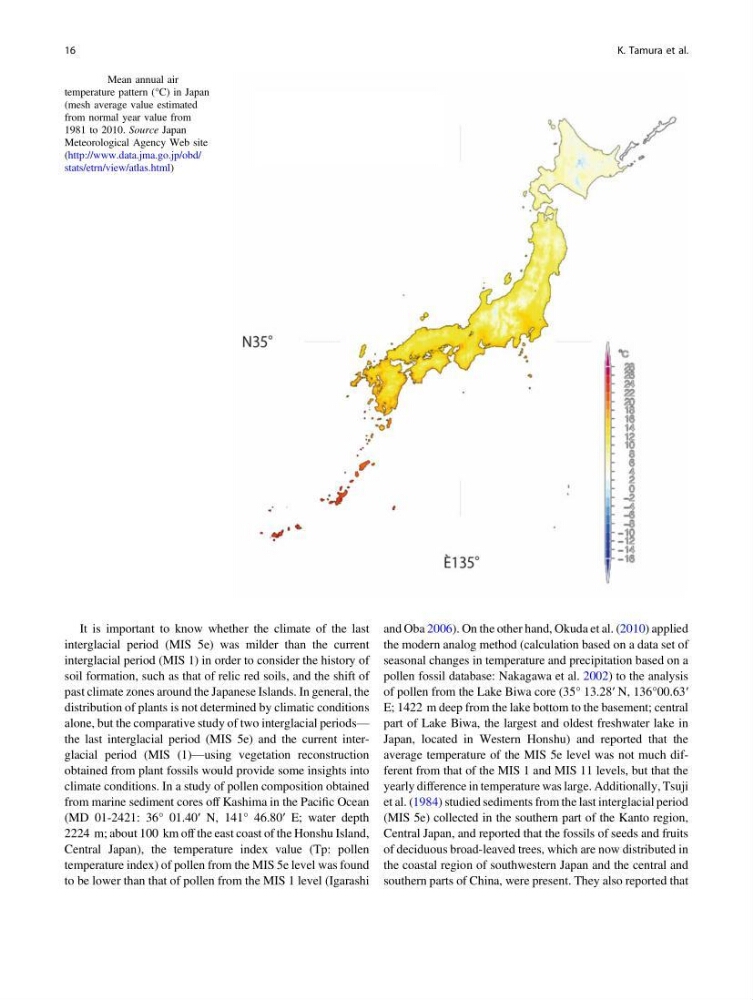
Fig. 2.3 Mean annual air
temperature pattern (°C) in Japan
(mesh average value estimated
from normal year value from
1981 to 2010. Source Japan
Meteorological Agency Web site
(http://www.data.jma.go.jp/obd/
stats/etrn/view/atlas.html)
16
K. Tamura et al.
interglacial period (MIS 5e) was milder than the current
interglacial period (MIS 1) in order to consider the history of
soil formation, such as that of relic red soils, and the shift of
past climate zones around the Japanese Islands. In general, the
distribution of plants is not determined by climatic conditions
alone, but the comparative study of two interglacial periods—
the last interglacial period (MIS 5e) and the current interglacial period (MIS (1)—using vegetation reconstruction
obtained from plant fossils would provide some insights into
climate conditions. In a study of pollen composition obtained
from marine sediment cores off Kashima in the Pacific Ocean
(MD 01-2421: 36° 01.40′ N, 141° 46.80′ E; water depth
2224 m; about 100 km off the east coast of the Honshu Island,
Central Japan), the temperature index value (Tp: pollen
temperature index) of pollen from the MIS 5e level was found
to be lower than that of pollen from the MIS 1 level (Igarashi
and Oba 2006). On the other hand, Okuda et al. (2010) applied
the modern analog method (calculation based on a data set of
seasonal changes in temperature and precipitation based on a
pollen fossil database: Nakagawa et al. 2002) to the analysis
of pollen from the Lake Biwa core (35° 13.28′ N, 136°00.63′
E; 1422 m deep from the lake bottom to the basement; central
part of Lake Biwa, the largest and oldest freshwater lake in
Japan, located in Western Honshu) and reported that the
average temperature of the MIS 5e level was not much different from that of the MIS 1 and MIS 11 levels, but that the
yearly difference in temperature was large. Additionally, Tsuji
et al. (1984) studied sediments from the last interglacial period
(MIS 5e) collected in the southern part of the Kanto region,
Central Japan, and reported that the fossils of seeds and fruits
of deciduous broad-leaved trees, which are now distributed in
the coastal region of southwestern Japan and the central and
southern parts of China, were present. They also reported that
Fig. 2.3 Mean annual air
temperature pattern (°C) in Japan
(mesh average value estimated
from normal year value from
1981 to 2010. Source Japan
Meteorological Agency Web site
(http://www.data.jma.go.jp/obd/
stats/etrn/view/atlas.html)
16
K. Tamura et al.