

6.7 Information and Communication
Technology
6.7.1 ICT for Fertilizer Management
(1) Aerial photographic system using a drone equipped
with a multispectral camera
In an effort to evaluate the growth conditions of the entire
studied farmland over a wide range and at high speed, we
used an aerial photographic system equipped with a multispectral camera mounted on a drone. The system consists of
the drone, the multispectral camera, a GPS, and an azimuth
meter. The multispectral camera was equipped with a
bandpass filter that selects only visible/near-infrared light
(i.e., making it a monochrome camera). The camera and GPS
were controlled by a tablet PC, and the accumulated images
were output by flash memory. The maximum flight time of
the drone was eight minutes, during which it was possible to
capture images over approximately 2 ha. The ground resolution at a flight altitude of 30 m was 3 cm. Up to 40–50
images could be captured from a 30-ha field.
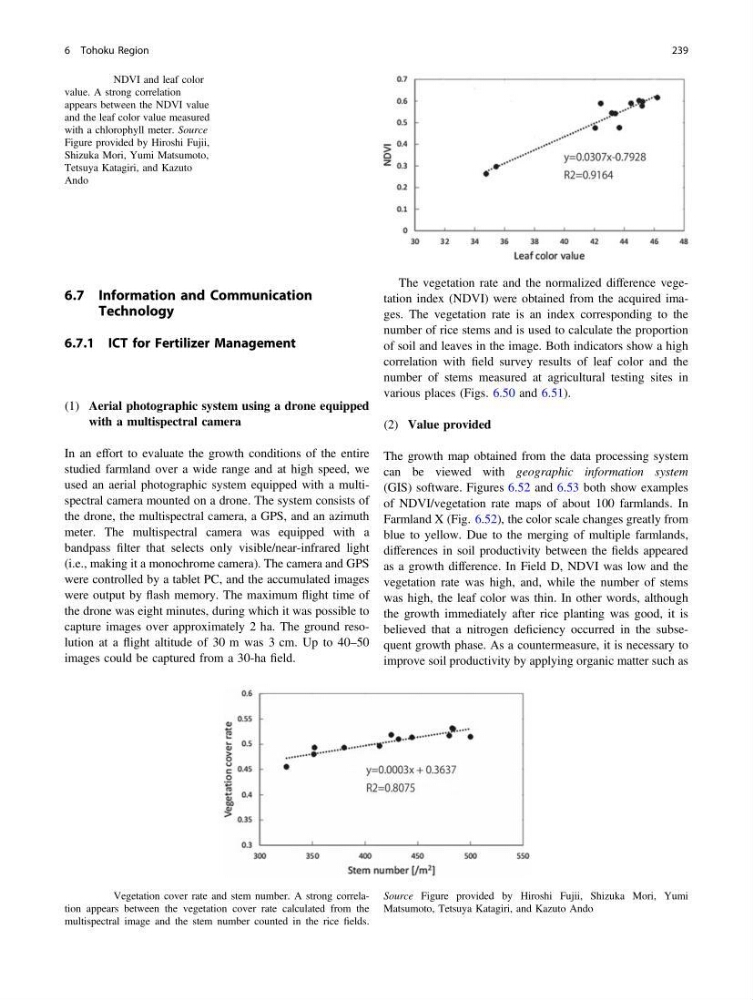
The vegetation rate and the normalized difference vegetation index (NDVI) were obtained from the acquired images. The vegetation rate is an index corresponding to the
number of rice stems and is used to calculate the proportion
of soil and leaves in the image. Both indicators show a high
correlation with field survey results of leaf color and the
number of stems measured at agricultural testing sites in
various places (Figs. 6.50 and 6.51).
(2) Value provided
The growth map obtained from the data processing system
can be viewed with geographic information system
(GIS) software. Figures 6.52 and 6.53 both show examples
of NDVI/vegetation rate maps of about 100 farmlands. In
Farmland X (Fig. 6.52), the color scale changes greatly from
blue to yellow. Due to the merging of multiple farmlands,
differences in soil productivity between the fields appeared
as a growth difference. In Field D, NDVI was low and the
vegetation rate was high, and, while the number of stems
was high, the leaf color was thin. In other words, although
the growth immediately after rice planting was good, it is
believed that a nitrogen deficiency occurred in the subsequent growth phase. As a countermeasure, it is necessary to
improve soil productivity by applying organic matter such as
Fig. 6.50 NDVI and leaf color
value. A strong correlation
appears between the NDVI value
and the leaf color value measured
with a chlorophyll meter. Source
Figure provided by Hiroshi Fujii,
Shizuka Mori, Yumi Matsumoto,
Tetsuya Katagiri, and Kazuto
Ando
Fig. 6.51 Vegetation cover rate and stem number. A strong correlation appears between the vegetation cover rate calculated from the
multispectral image and the stem number counted in the rice fields.
Source Figure provided by Hiroshi Fujii, Shizuka Mori, Yumi
Matsumoto, Tetsuya Katagiri, and Kazuto Ando
6 Tohoku Region
239
Technology
6.7.1 ICT for Fertilizer Management
(1) Aerial photographic system using a drone equipped
with a multispectral camera
In an effort to evaluate the growth conditions of the entire
studied farmland over a wide range and at high speed, we
used an aerial photographic system equipped with a multispectral camera mounted on a drone. The system consists of
the drone, the multispectral camera, a GPS, and an azimuth
meter. The multispectral camera was equipped with a
bandpass filter that selects only visible/near-infrared light
(i.e., making it a monochrome camera). The camera and GPS
were controlled by a tablet PC, and the accumulated images
were output by flash memory. The maximum flight time of
the drone was eight minutes, during which it was possible to
capture images over approximately 2 ha. The ground resolution at a flight altitude of 30 m was 3 cm. Up to 40–50
images could be captured from a 30-ha field.
The vegetation rate and the normalized difference vegetation index (NDVI) were obtained from the acquired images. The vegetation rate is an index corresponding to the
number of rice stems and is used to calculate the proportion
of soil and leaves in the image. Both indicators show a high
correlation with field survey results of leaf color and the
number of stems measured at agricultural testing sites in
various places (Figs. 6.50 and 6.51).
(2) Value provided
The growth map obtained from the data processing system
can be viewed with geographic information system
(GIS) software. Figures 6.52 and 6.53 both show examples
of NDVI/vegetation rate maps of about 100 farmlands. In
Farmland X (Fig. 6.52), the color scale changes greatly from
blue to yellow. Due to the merging of multiple farmlands,
differences in soil productivity between the fields appeared
as a growth difference. In Field D, NDVI was low and the
vegetation rate was high, and, while the number of stems
was high, the leaf color was thin. In other words, although
the growth immediately after rice planting was good, it is
believed that a nitrogen deficiency occurred in the subsequent growth phase. As a countermeasure, it is necessary to
improve soil productivity by applying organic matter such as
Fig. 6.50 NDVI and leaf color
value. A strong correlation
appears between the NDVI value
and the leaf color value measured
with a chlorophyll meter. Source
Figure provided by Hiroshi Fujii,
Shizuka Mori, Yumi Matsumoto,
Tetsuya Katagiri, and Kazuto
Ando
Fig. 6.51 Vegetation cover rate and stem number. A strong correlation appears between the vegetation cover rate calculated from the
multispectral image and the stem number counted in the rice fields.
Source Figure provided by Hiroshi Fujii, Shizuka Mori, Yumi
Matsumoto, Tetsuya Katagiri, and Kazuto Ando
6 Tohoku Region
239