

on the forest floor and in the soil in a forest of Japanese cedar
(Cryptomeria japonica) with different thinning intensity.
The forest belongs to the Field Science Center of Tohoku
University and is located 150 km north of the FDNPS.
Following the 2011 incident, the forest was contaminated
with radiocesium fallout. The radiocesium fallout in this area
was estimated at 30–60 kBq m
−2 based upon aerial survey
(MEXT 2011) and ground survey of neighboring pastures
(Ogura et al. 2014). A part of the forest was thinned by up to
67% and the rest was kept unthinned. In the unthinned part,
the tree density was about 12,000 trees/ha, and almost the
whole area was covered with Japanese cedar canopy and
minor understory vegetation. In the thinned part, the tree
density was about 4000 trees/ha, and various broad-leaved
shrubs grew well as understory among cedar trees
(Fig. 6.48). The soil is Non-allophanic Andosol.
Samplings of litter and soil were conducted in June 2011
and June 2014. Litter samples collected from the forest floor
(O layer) were classified into a twig, cedar leaves, broad
leaves, and humified litter. Soil was collected from depths of
0 to 30 cm. radiocesium in these samples was measured with
a gamma counter. The measured
137 Cs values were expressed on an area basis. The total litter weight per area was not
different between in the thinned and the unthinned plots,
while the proportion of “broad leaves” litter was much
higher in the thinned plot than in the unthinned plot. Soil
carbon content and C/N ratio were slightly higher in the
unthinned plot due to the thick accumulation of Japanese
cedar litter. No changes were found between the two sampling times.
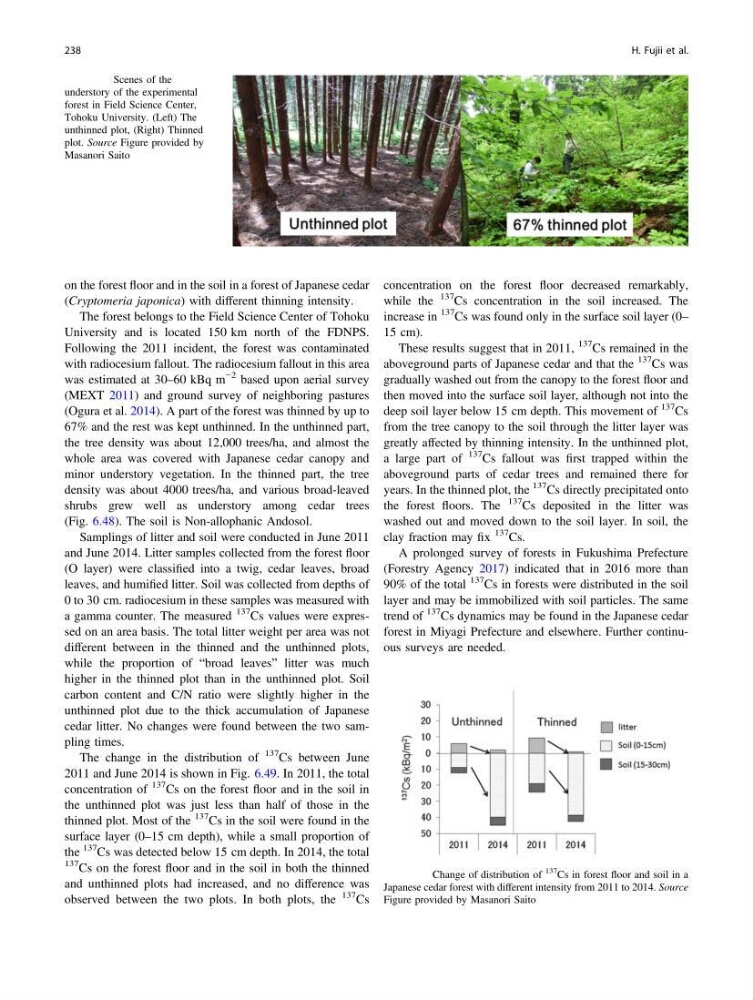
The change in the distribution of
137 Cs between June
2011 and June 2014 is shown in Fig. 6.49. In 2011, the total
concentration of
137 Cs on the forest floor and in the soil in
the unthinned plot was just less than half of those in the
thinned plot. Most of the
137 Cs in the soil were found in the
surface layer (0–15 cm depth), while a small proportion of
the
137 Cs was detected below 15 cm depth. In 2014, the total
137 Cs on the forest floor and in the soil in both the thinned
and unthinned plots had increased, and no difference was
observed between the two plots. In both plots, the
137 Cs
concentration on the forest floor decreased remarkably,
while the
137
Cs concentration in the soil increased. The
increase in
137 Cs was found only in the surface soil layer (0–
15 cm).
These results suggest that in 2011,
137 Cs remained in the
aboveground parts of Japanese cedar and that the
137 Cs was
gradually washed out from the canopy to the forest floor and
then moved into the surface soil layer, although not into the
deep soil layer below 15 cm depth. This movement of
137 Cs
from the tree canopy to the soil through the litter layer was
greatly affected by thinning intensity. In the unthinned plot,
a large part of
137
Cs fallout was first trapped within the
aboveground parts of cedar trees and remained there for
years. In the thinned plot, the
137 Cs directly precipitated onto
the forest floors. The
137 Cs deposited in the litter was
washed out and moved down to the soil layer. In soil, the
clay fraction may fix
137 Cs.
A prolonged survey of forests in Fukushima Prefecture
(Forestry Agency 2017) indicated that in 2016 more than
90% of the total
137 Cs in forests were distributed in the soil
layer and may be immobilized with soil particles. The same
trend of
137 Cs dynamics may be found in the Japanese cedar
forest in Miyagi Prefecture and elsewhere. Further continuous surveys are needed.
Fig. 6.48 Scenes of the
understory of the experimental
forest in Field Science Center,
Tohoku University. (Left) The
unthinned plot, (Right) Thinned
plot. Source Figure provided by
Masanori Saito
Fig. 6.49 Change of distribution of
137 Cs in forest floor and soil in a
Japanese cedar forest with different intensity from 2011 to 2014. Source
Figure provided by Masanori Saito
238
H. Fujii et al.
(Cryptomeria japonica) with different thinning intensity.
The forest belongs to the Field Science Center of Tohoku
University and is located 150 km north of the FDNPS.
Following the 2011 incident, the forest was contaminated
with radiocesium fallout. The radiocesium fallout in this area
was estimated at 30–60 kBq m
−2 based upon aerial survey
(MEXT 2011) and ground survey of neighboring pastures
(Ogura et al. 2014). A part of the forest was thinned by up to
67% and the rest was kept unthinned. In the unthinned part,
the tree density was about 12,000 trees/ha, and almost the
whole area was covered with Japanese cedar canopy and
minor understory vegetation. In the thinned part, the tree
density was about 4000 trees/ha, and various broad-leaved
shrubs grew well as understory among cedar trees
(Fig. 6.48). The soil is Non-allophanic Andosol.
Samplings of litter and soil were conducted in June 2011
and June 2014. Litter samples collected from the forest floor
(O layer) were classified into a twig, cedar leaves, broad
leaves, and humified litter. Soil was collected from depths of
0 to 30 cm. radiocesium in these samples was measured with
a gamma counter. The measured
137 Cs values were expressed on an area basis. The total litter weight per area was not
different between in the thinned and the unthinned plots,
while the proportion of “broad leaves” litter was much
higher in the thinned plot than in the unthinned plot. Soil
carbon content and C/N ratio were slightly higher in the
unthinned plot due to the thick accumulation of Japanese
cedar litter. No changes were found between the two sampling times.
The change in the distribution of
137 Cs between June
2011 and June 2014 is shown in Fig. 6.49. In 2011, the total
concentration of
137 Cs on the forest floor and in the soil in
the unthinned plot was just less than half of those in the
thinned plot. Most of the
137 Cs in the soil were found in the
surface layer (0–15 cm depth), while a small proportion of
the
137 Cs was detected below 15 cm depth. In 2014, the total
137 Cs on the forest floor and in the soil in both the thinned
and unthinned plots had increased, and no difference was
observed between the two plots. In both plots, the
137 Cs
concentration on the forest floor decreased remarkably,
while the
137
Cs concentration in the soil increased. The
increase in
137 Cs was found only in the surface soil layer (0–
15 cm).
These results suggest that in 2011,
137 Cs remained in the
aboveground parts of Japanese cedar and that the
137 Cs was
gradually washed out from the canopy to the forest floor and
then moved into the surface soil layer, although not into the
deep soil layer below 15 cm depth. This movement of
137 Cs
from the tree canopy to the soil through the litter layer was
greatly affected by thinning intensity. In the unthinned plot,
a large part of
137
Cs fallout was first trapped within the
aboveground parts of cedar trees and remained there for
years. In the thinned plot, the
137 Cs directly precipitated onto
the forest floors. The
137 Cs deposited in the litter was
washed out and moved down to the soil layer. In soil, the
clay fraction may fix
137 Cs.
A prolonged survey of forests in Fukushima Prefecture
(Forestry Agency 2017) indicated that in 2016 more than
90% of the total
137 Cs in forests were distributed in the soil
layer and may be immobilized with soil particles. The same
trend of
137 Cs dynamics may be found in the Japanese cedar
forest in Miyagi Prefecture and elsewhere. Further continuous surveys are needed.
Fig. 6.48 Scenes of the
understory of the experimental
forest in Field Science Center,
Tohoku University. (Left) The
unthinned plot, (Right) Thinned
plot. Source Figure provided by
Masanori Saito
Fig. 6.49 Change of distribution of
137 Cs in forest floor and soil in a
Japanese cedar forest with different intensity from 2011 to 2014. Source
Figure provided by Masanori Saito
238
H. Fujii et al.