

compost and preparing the soil with fertilizer. These variations in rice growth occur due to variations in soil productivity, and efficient soil improvement is possible by
“visualizing” growth in farmland.
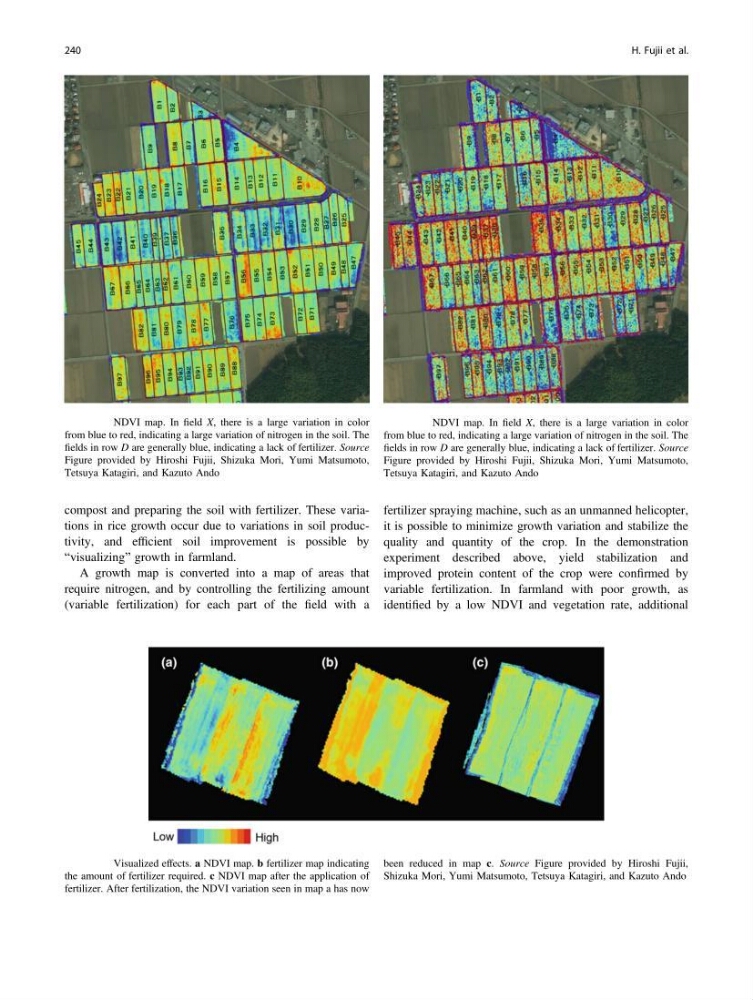
A growth map is converted into a map of areas that
require nitrogen, and by controlling the fertilizing amount
(variable fertilization) for each part of the field with a
fertilizer spraying machine, such as an unmanned helicopter,
it is possible to minimize growth variation and stabilize the
quality and quantity of the crop. In the demonstration
experiment described above, yield stabilization and
improved protein content of the crop were confirmed by
variable fertilization. In farmland with poor growth, as
identified by a low NDVI and vegetation rate, additional
Fig. 6.52 NDVI map. In field X, there is a large variation in color
from blue to red, indicating a large variation of nitrogen in the soil. The
fields in row D are generally blue, indicating a lack of fertilizer. Source
Figure provided by Hiroshi Fujii, Shizuka Mori, Yumi Matsumoto,
Tetsuya Katagiri, and Kazuto Ando
Fig. 6.53 NDVI map. In field X, there is a large variation in color
from blue to red, indicating a large variation of nitrogen in the soil. The
fields in row D are generally blue, indicating a lack of fertilizer. Source
Figure provided by Hiroshi Fujii, Shizuka Mori, Yumi Matsumoto,
Tetsuya Katagiri, and Kazuto Ando
Fig. 6.54 Visualized effects. a NDVI map. b fertilizer map indicating
the amount of fertilizer required. c NDVI map after the application of
fertilizer. After fertilization, the NDVI variation seen in map a has now
been reduced in map c. Source Figure provided by Hiroshi Fujii,
Shizuka Mori, Yumi Matsumoto, Tetsuya Katagiri, and Kazuto Ando
240
H. Fujii et al.
“visualizing” growth in farmland.
A growth map is converted into a map of areas that
require nitrogen, and by controlling the fertilizing amount
(variable fertilization) for each part of the field with a
fertilizer spraying machine, such as an unmanned helicopter,
it is possible to minimize growth variation and stabilize the
quality and quantity of the crop. In the demonstration
experiment described above, yield stabilization and
improved protein content of the crop were confirmed by
variable fertilization. In farmland with poor growth, as
identified by a low NDVI and vegetation rate, additional
Fig. 6.52 NDVI map. In field X, there is a large variation in color
from blue to red, indicating a large variation of nitrogen in the soil. The
fields in row D are generally blue, indicating a lack of fertilizer. Source
Figure provided by Hiroshi Fujii, Shizuka Mori, Yumi Matsumoto,
Tetsuya Katagiri, and Kazuto Ando
Fig. 6.53 NDVI map. In field X, there is a large variation in color
from blue to red, indicating a large variation of nitrogen in the soil. The
fields in row D are generally blue, indicating a lack of fertilizer. Source
Figure provided by Hiroshi Fujii, Shizuka Mori, Yumi Matsumoto,
Tetsuya Katagiri, and Kazuto Ando
Fig. 6.54 Visualized effects. a NDVI map. b fertilizer map indicating
the amount of fertilizer required. c NDVI map after the application of
fertilizer. After fertilization, the NDVI variation seen in map a has now
been reduced in map c. Source Figure provided by Hiroshi Fujii,
Shizuka Mori, Yumi Matsumoto, Tetsuya Katagiri, and Kazuto Ando
240
H. Fujii et al.