

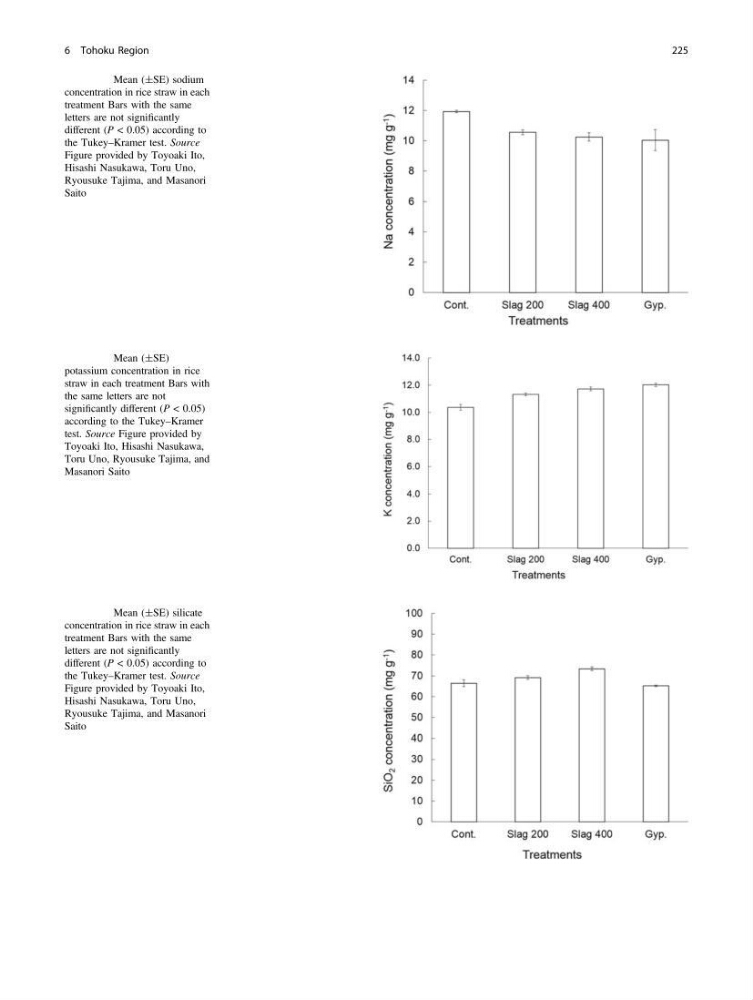
Fig. 6.32 Mean (±SE) sodium
concentration in rice straw in each
treatment Bars with the same
letters are not significantly
different (P < 0.05) according to
the Tukey–Kramer test. Source
Figure provided by Toyoaki Ito,
Hisashi Nasukawa, Toru Uno,
Ryousuke Tajima, and Masanori
Saito
Fig. 6.33 Mean (±SE)
potassium concentration in rice
straw in each treatment Bars with
the same letters are not
significantly different (P < 0.05)
according to the Tukey–Kramer
test. Source Figure provided by
Toyoaki Ito, Hisashi Nasukawa,
Toru Uno, Ryousuke Tajima, and
Masanori Saito
Fig. 6.34 Mean (±SE) silicate
concentration in rice straw in each
treatment Bars with the same
letters are not significantly
different (P < 0.05) according to
the Tukey–Kramer test. Source
Figure provided by Toyoaki Ito,
Hisashi Nasukawa, Toru Uno,
Ryousuke Tajima, and Masanori
Saito
6 Tohoku Region
225
concentration in rice straw in each
treatment Bars with the same
letters are not significantly
different (P < 0.05) according to
the Tukey–Kramer test. Source
Figure provided by Toyoaki Ito,
Hisashi Nasukawa, Toru Uno,
Ryousuke Tajima, and Masanori
Saito
Fig. 6.33 Mean (±SE)
potassium concentration in rice
straw in each treatment Bars with
the same letters are not
significantly different (P < 0.05)
according to the Tukey–Kramer
test. Source Figure provided by
Toyoaki Ito, Hisashi Nasukawa,
Toru Uno, Ryousuke Tajima, and
Masanori Saito
Fig. 6.34 Mean (±SE) silicate
concentration in rice straw in each
treatment Bars with the same
letters are not significantly
different (P < 0.05) according to
the Tukey–Kramer test. Source
Figure provided by Toyoaki Ito,
Hisashi Nasukawa, Toru Uno,
Ryousuke Tajima, and Masanori
Saito
6 Tohoku Region
225