

limit (Fig. 6.23). The soil tillability improves as a result of
this process because the dominant yield pattern changes
from plastic deformation to brittle fracture in the ordinal
conditions of field water content.
As mentioned above, the drying history of soil drives the
change in its physical properties by conversion. The “uplandization index” is an index used to quantitatively express
the progress of the change of soil physical properties toward
that of a completely upland field; its value ranges from 0 to
1, with a value of 1 indicating that the subjected field has
completely upland properties. The uplandization index uses
the sediment volume of the paddy field and upland field
conditions. Sediment volume is defined as the volume of
well-puddled soil in 40 mmol L
−1 of NH 4 Cl solution, which
is considered as an index of soil microstructure. It is known
that the sediment volume is decreased by conversion to
upland field and increased by conversion to the paddy field
(Fig. 6.24). The uplandization index is calculated by the
following equation (Naganoma and Moroyu 1983):
Uplandization Index ¼
V p À V
V p À V u
where V, V p , and V u indicate the sediment volume of the
subjected field, the sediment volume of the continuous
paddy field near the subjected field, and the sediment volume of the continuous upland field near the subjected field or
of the air-dried soil in the subjected field.
What is the nature of uplandization index? The sediment
volume decreases irreversibly due to soil drying to a water
potential exceeding −1.5 MPa (Katou et al. 1985). The
sediment volume is related to the properties of well-puddled
soil. This implies that the soil microstructure is changed by
drying exceeding −1.5 MPa, and this change is not easily
restored by puddling. Additionally, the soil microstructure
does not disappear in the rewetting process, because sediment volume is measured in solution. In conclusion, the
uplandization index shows the soil microstructure that
results from drying exceeding −1.5 MPa and that is not
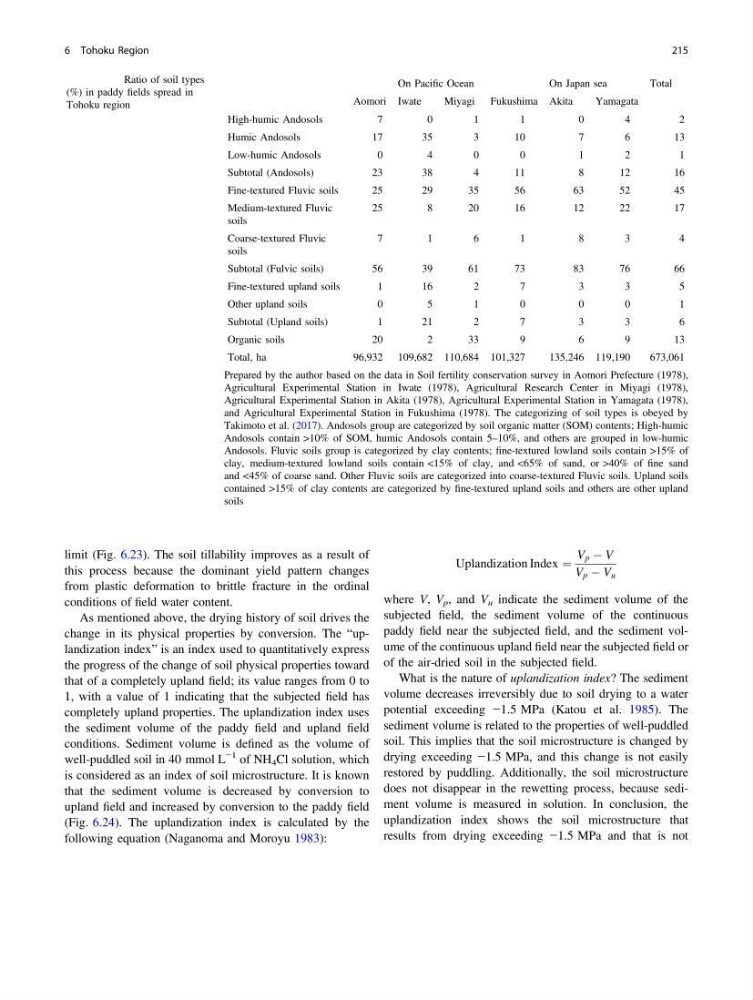
Table 6.10 Ratio of soil types
(%) in paddy fields spread in
Tohoku region
On Pacific Ocean
On Japan sea
Total
Aomori Iwate
Miyagi Fukushima Akita
Yamagata
High-humic Andosols
7
0
1
1
0
4
2
Humic Andosols
17
35
3
10
7
6
13
Low-humic Andosols
0
4
0
0
1
2
1
Subtotal (Andosols)
23
38
4
11
8
12
16
Fine-textured Fluvic soils
25
29
35
56
63
52
45
Medium-textured Fluvic
soils
25
8
20
16
12
22
17
Coarse-textured Fluvic
soils
7
1
6
1
8
3
4
Subtotal (Fulvic soils)
56
39
61
73
83
76
66
Fine-textured upland soils
1
16
2
7
3
3
5
Other upland soils
0
5
1
0
0
0
1
Subtotal (Upland soils)
1
21
2
7
3
3
6
Organic soils
20
2
33
9
6
9
13
Total, ha
96,932 109,682 110,684 101,327
135,246 119,190
673,061
Prepared by the author based on the data in Soil fertility conservation survey in Aomori Prefecture (1978),
Agricultural Experimental Station in Iwate (1978), Agricultural Research Center in Miyagi (1978),
Agricultural Experimental Station in Akita (1978), Agricultural Experimental Station in Yamagata (1978),
and Agricultural Experimental Station in Fukushima (1978). The categorizing of soil types is obeyed by
Takimoto et al. (2017). Andosols group are categorized by soil organic matter (SOM) contents; High-humic
Andosols contain >10% of SOM, humic Andosols contain 5–10%, and others are grouped in low-humic
Andosols. Fluvic soils group is categorized by clay contents; fine-textured lowland soils contain >15% of
clay, medium-textured lowland soils contain <15% of clay, and <65% of sand, or >40% of fine sand
and <45% of coarse sand. Other Fluvic soils are categorized into coarse-textured Fluvic soils. Upland soils
contained >15% of clay contents are categorized by fine-textured upland soils and others are other upland
soils
6 Tohoku Region
215
this process because the dominant yield pattern changes
from plastic deformation to brittle fracture in the ordinal
conditions of field water content.
As mentioned above, the drying history of soil drives the
change in its physical properties by conversion. The “uplandization index” is an index used to quantitatively express
the progress of the change of soil physical properties toward
that of a completely upland field; its value ranges from 0 to
1, with a value of 1 indicating that the subjected field has
completely upland properties. The uplandization index uses
the sediment volume of the paddy field and upland field
conditions. Sediment volume is defined as the volume of
well-puddled soil in 40 mmol L
−1 of NH 4 Cl solution, which
is considered as an index of soil microstructure. It is known
that the sediment volume is decreased by conversion to
upland field and increased by conversion to the paddy field
(Fig. 6.24). The uplandization index is calculated by the
following equation (Naganoma and Moroyu 1983):
Uplandization Index ¼
V p À V
V p À V u
where V, V p , and V u indicate the sediment volume of the
subjected field, the sediment volume of the continuous
paddy field near the subjected field, and the sediment volume of the continuous upland field near the subjected field or
of the air-dried soil in the subjected field.
What is the nature of uplandization index? The sediment
volume decreases irreversibly due to soil drying to a water
potential exceeding −1.5 MPa (Katou et al. 1985). The
sediment volume is related to the properties of well-puddled
soil. This implies that the soil microstructure is changed by
drying exceeding −1.5 MPa, and this change is not easily
restored by puddling. Additionally, the soil microstructure
does not disappear in the rewetting process, because sediment volume is measured in solution. In conclusion, the
uplandization index shows the soil microstructure that
results from drying exceeding −1.5 MPa and that is not
Table 6.10 Ratio of soil types
(%) in paddy fields spread in
Tohoku region
On Pacific Ocean
On Japan sea
Total
Aomori Iwate
Miyagi Fukushima Akita
Yamagata
High-humic Andosols
7
0
1
1
0
4
2
Humic Andosols
17
35
3
10
7
6
13
Low-humic Andosols
0
4
0
0
1
2
1
Subtotal (Andosols)
23
38
4
11
8
12
16
Fine-textured Fluvic soils
25
29
35
56
63
52
45
Medium-textured Fluvic
soils
25
8
20
16
12
22
17
Coarse-textured Fluvic
soils
7
1
6
1
8
3
4
Subtotal (Fulvic soils)
56
39
61
73
83
76
66
Fine-textured upland soils
1
16
2
7
3
3
5
Other upland soils
0
5
1
0
0
0
1
Subtotal (Upland soils)
1
21
2
7
3
3
6
Organic soils
20
2
33
9
6
9
13
Total, ha
96,932 109,682 110,684 101,327
135,246 119,190
673,061
Prepared by the author based on the data in Soil fertility conservation survey in Aomori Prefecture (1978),
Agricultural Experimental Station in Iwate (1978), Agricultural Research Center in Miyagi (1978),
Agricultural Experimental Station in Akita (1978), Agricultural Experimental Station in Yamagata (1978),
and Agricultural Experimental Station in Fukushima (1978). The categorizing of soil types is obeyed by
Takimoto et al. (2017). Andosols group are categorized by soil organic matter (SOM) contents; High-humic
Andosols contain >10% of SOM, humic Andosols contain 5–10%, and others are grouped in low-humic
Andosols. Fluvic soils group is categorized by clay contents; fine-textured lowland soils contain >15% of
clay, medium-textured lowland soils contain <15% of clay, and <65% of sand, or >40% of fine sand
and <45% of coarse sand. Other Fluvic soils are categorized into coarse-textured Fluvic soils. Upland soils
contained >15% of clay contents are categorized by fine-textured upland soils and others are other upland
soils
6 Tohoku Region
215