

The second factor that decreases the yield of upland crops
is the existence of a plow pan. The depth of the plow layer in
paddy fields is about 11–13 cm, and below this there is a
low-permeability plow pan which maintains flooded conditions. During upland cropping, this plow pan often leads to
the presence of excess water in the field, causing water
damage to crops.
(1) Process of changing to upland soil
The general profile of paddy soils shows a massive structure
that indicates very weak development of soil structure,
which results from periodic paddling and the lack of a
continual soil wetting–drying cycle due to flooding.
The conversion of paddy field to upland field forces
strong drying. Capillary forces developed by the drying
process compress soil, decreasing the volume of micropores
and amount of water retention. Thus, soil develops
hydrophobic properties by the conversion to upland field. On
the contrary, cracking that occurs due to the drying process
increases the water content of soil micropores to greater than
−6.2 kPa (Nakano 1978). Consequently, soil structure that is
unique to upland soil forms gradually (Fig. 6.23).
In terms of field management, it is important to change
the water potential of field capacity. Upland fields converted
from rice paddy field show a low tillability and it is hard to
obtain good soil tilth. When the conversion period to upland
field increases, field capacity becomes close to the plastic
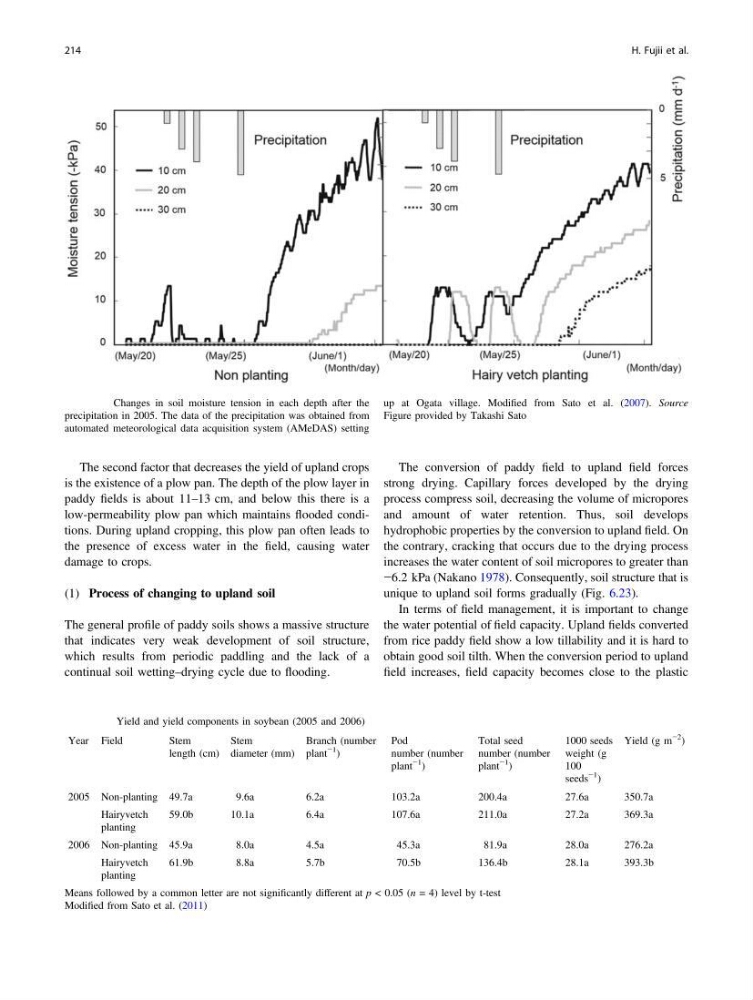
Fig. 6.22 Changes in soil moisture tension in each depth after the
precipitation in 2005. The data of the precipitation was obtained from
automated meteorological data acquisition system (AMeDAS) setting
up at Ogata village. Modified from Sato et al. (2007). Source
Figure provided by Takashi Sato
Table 6.9 Yield and yield components in soybean (2005 and 2006)
Year Field
Stem
length (cm)
Stem
diameter (mm)
Branch (number
plant
−1
)
Pod
number (number
plant
−1
)
Total seed
number (number
plant
−1
)
1000 seeds
weight (g
100
seeds
−1
)
Yield (g m
−2
)
2005 Non-planting 49.7a
9.6a
6.2a
103.2a
200.4a
27.6a
350.7a
Hairyvetch
planting
59.0b
10.1a
6.4a
107.6a
211.0a
27.2a
369.3a
2006 Non-planting 45.9a
8.0a
4.5a
45.3a
81.9a
28.0a
276.2a
Hairyvetch
planting
61.9b
8.8a
5.7b
70.5b
136.4b
28.1a
393.3b
Means followed by a common letter are not significantly different at p < 0.05 (n = 4) level by t-test
Modified from Sato et al. (2011)
214
H. Fujii et al.
is the existence of a plow pan. The depth of the plow layer in
paddy fields is about 11–13 cm, and below this there is a
low-permeability plow pan which maintains flooded conditions. During upland cropping, this plow pan often leads to
the presence of excess water in the field, causing water
damage to crops.
(1) Process of changing to upland soil
The general profile of paddy soils shows a massive structure
that indicates very weak development of soil structure,
which results from periodic paddling and the lack of a
continual soil wetting–drying cycle due to flooding.
The conversion of paddy field to upland field forces
strong drying. Capillary forces developed by the drying
process compress soil, decreasing the volume of micropores
and amount of water retention. Thus, soil develops
hydrophobic properties by the conversion to upland field. On
the contrary, cracking that occurs due to the drying process
increases the water content of soil micropores to greater than
−6.2 kPa (Nakano 1978). Consequently, soil structure that is
unique to upland soil forms gradually (Fig. 6.23).
In terms of field management, it is important to change
the water potential of field capacity. Upland fields converted
from rice paddy field show a low tillability and it is hard to
obtain good soil tilth. When the conversion period to upland
field increases, field capacity becomes close to the plastic
Fig. 6.22 Changes in soil moisture tension in each depth after the
precipitation in 2005. The data of the precipitation was obtained from
automated meteorological data acquisition system (AMeDAS) setting
up at Ogata village. Modified from Sato et al. (2007). Source
Figure provided by Takashi Sato
Table 6.9 Yield and yield components in soybean (2005 and 2006)
Year Field
Stem
length (cm)
Stem
diameter (mm)
Branch (number
plant
−1
)
Pod
number (number
plant
−1
)
Total seed
number (number
plant
−1
)
1000 seeds
weight (g
100
seeds
−1
)
Yield (g m
−2
)
2005 Non-planting 49.7a
9.6a
6.2a
103.2a
200.4a
27.6a
350.7a
Hairyvetch
planting
59.0b
10.1a
6.4a
107.6a
211.0a
27.2a
369.3a
2006 Non-planting 45.9a
8.0a
4.5a
45.3a
81.9a
28.0a
276.2a
Hairyvetch
planting
61.9b
8.8a
5.7b
70.5b
136.4b
28.1a
393.3b
Means followed by a common letter are not significantly different at p < 0.05 (n = 4) level by t-test
Modified from Sato et al. (2011)
214
H. Fujii et al.