

Although the timing of application is later during the
panicle formation stage and the amount of calcium silicate
needed is lower than that needed for the entire growth phase,
the amount of silicate absorbed was observed to be equal to
or greater than that for calcium silicate application over the
entire growth phase (Table 6.4).
The amount of nitrogen absorbed at the mature stage of
crop growth was higher in the silicate application plot than
in the silicate-free plot, and the utilization rate of the topdressed nitrogen increased during the panicle formation
stage due to application of silicic acid (full layer application
and surface application). The increase in the number of
spikelte rice achieved with silicate application is thought to
be related to the increase in the utilization rate of topdressed
nitrogen and the increased nitrogen absorption during the
panicle formation stage (Table 6.4).
6.2.4 Application Standard of Silicate Fertilizer
(1) Background on formulation of application
standards
A particularly tasty variety of rice, ‘Seitein no Hekireki’, is
currently cultivated in Aomori Prefecture. This rice has a
rice protein content (a metric negatively related to the taste
of rice required to meet market standards) of 6.4% or less,
achieved with the conversion of 15% moisture content ratio.
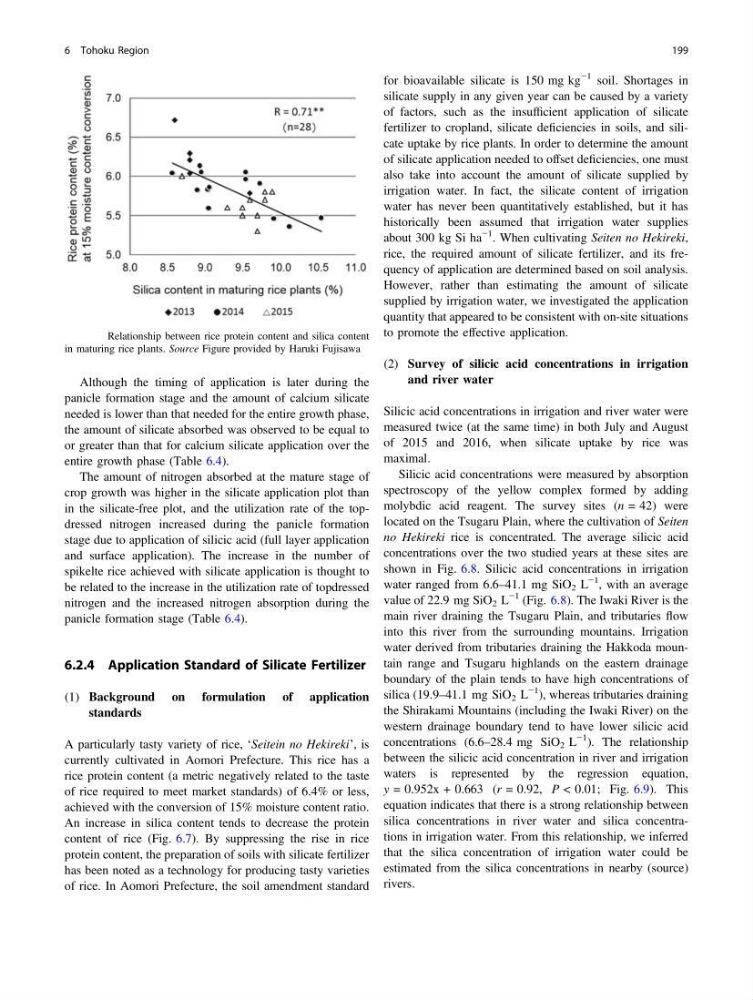
An increase in silica content tends to decrease the protein
content of rice (Fig. 6.7). By suppressing the rise in rice
protein content, the preparation of soils with silicate fertilizer
has been noted as a technology for producing tasty varieties
of rice. In Aomori Prefecture, the soil amendment standard
for bioavailable silicate is 150 mg kg
−1 soil. Shortages in
silicate supply in any given year can be caused by a variety
of factors, such as the insufficient application of silicate
fertilizer to cropland, silicate deficiencies in soils, and silicate uptake by rice plants. In order to determine the amount
of silicate application needed to offset deficiencies, one must
also take into account the amount of silicate supplied by
irrigation water. In fact, the silicate content of irrigation
water has never been quantitatively established, but it has
historically been assumed that irrigation water supplies
about 300 kg Si ha
−1 . When cultivating Seiten no Hekireki,
rice, the required amount of silicate fertilizer, and its frequency of application are determined based on soil analysis.
However, rather than estimating the amount of silicate
supplied by irrigation water, we investigated the application
quantity that appeared to be consistent with on-site situations
to promote the effective application.
(2) Survey of silicic acid concentrations in irrigation
and river water
Silicic acid concentrations in irrigation and river water were
measured twice (at the same time) in both July and August
of 2015 and 2016, when silicate uptake by rice was
maximal.
Silicic acid concentrations were measured by absorption
spectroscopy of the yellow complex formed by adding
molybdic acid reagent. The survey sites (n = 42) were
located on the Tsugaru Plain, where the cultivation of Seiten
no Hekireki rice is concentrated. The average silicic acid
concentrations over the two studied years at these sites are
shown in Fig. 6.8. Silicic acid concentrations in irrigation
water ranged from 6.6–41.1 mg SiO 2 L
−1 , with an average
value of 22.9 mg SiO 2 L
−1 (Fig. 6.8). The Iwaki River is the
main river draining the Tsugaru Plain, and tributaries flow
into this river from the surrounding mountains. Irrigation
water derived from tributaries draining the Hakkoda mountain range and Tsugaru highlands on the eastern drainage
boundary of the plain tends to have high concentrations of
silica (19.9–41.1 mg SiO 2 L
−1 ), whereas tributaries draining
the Shirakami Mountains (including the Iwaki River) on the
western drainage boundary tend to have lower silicic acid
concentrations (6.6–28.4 mg SiO 2 L
−1 ). The relationship
between the silicic acid concentration in river and irrigation
waters is represented by the regression equation,
y = 0.952x + 0.663 (r = 0.92, P < 0.01; Fig. 6.9). This
equation indicates that there is a strong relationship between
silica concentrations in river water and silica concentrations in irrigation water. From this relationship, we inferred
that the silica concentration of irrigation water could be
estimated from the silica concentrations in nearby (source)
rivers.
Fig. 6.7 Relationship between rice protein content and silica content
in maturing rice plants. Source Figure provided by Haruki Fujisawa
6 Tohoku Region
199
panicle formation stage and the amount of calcium silicate
needed is lower than that needed for the entire growth phase,
the amount of silicate absorbed was observed to be equal to
or greater than that for calcium silicate application over the
entire growth phase (Table 6.4).
The amount of nitrogen absorbed at the mature stage of
crop growth was higher in the silicate application plot than
in the silicate-free plot, and the utilization rate of the topdressed nitrogen increased during the panicle formation
stage due to application of silicic acid (full layer application
and surface application). The increase in the number of
spikelte rice achieved with silicate application is thought to
be related to the increase in the utilization rate of topdressed
nitrogen and the increased nitrogen absorption during the
panicle formation stage (Table 6.4).
6.2.4 Application Standard of Silicate Fertilizer
(1) Background on formulation of application
standards
A particularly tasty variety of rice, ‘Seitein no Hekireki’, is
currently cultivated in Aomori Prefecture. This rice has a
rice protein content (a metric negatively related to the taste
of rice required to meet market standards) of 6.4% or less,
achieved with the conversion of 15% moisture content ratio.
An increase in silica content tends to decrease the protein
content of rice (Fig. 6.7). By suppressing the rise in rice
protein content, the preparation of soils with silicate fertilizer
has been noted as a technology for producing tasty varieties
of rice. In Aomori Prefecture, the soil amendment standard
for bioavailable silicate is 150 mg kg
−1 soil. Shortages in
silicate supply in any given year can be caused by a variety
of factors, such as the insufficient application of silicate
fertilizer to cropland, silicate deficiencies in soils, and silicate uptake by rice plants. In order to determine the amount
of silicate application needed to offset deficiencies, one must
also take into account the amount of silicate supplied by
irrigation water. In fact, the silicate content of irrigation
water has never been quantitatively established, but it has
historically been assumed that irrigation water supplies
about 300 kg Si ha
−1 . When cultivating Seiten no Hekireki,
rice, the required amount of silicate fertilizer, and its frequency of application are determined based on soil analysis.
However, rather than estimating the amount of silicate
supplied by irrigation water, we investigated the application
quantity that appeared to be consistent with on-site situations
to promote the effective application.
(2) Survey of silicic acid concentrations in irrigation
and river water
Silicic acid concentrations in irrigation and river water were
measured twice (at the same time) in both July and August
of 2015 and 2016, when silicate uptake by rice was
maximal.
Silicic acid concentrations were measured by absorption
spectroscopy of the yellow complex formed by adding
molybdic acid reagent. The survey sites (n = 42) were
located on the Tsugaru Plain, where the cultivation of Seiten
no Hekireki rice is concentrated. The average silicic acid
concentrations over the two studied years at these sites are
shown in Fig. 6.8. Silicic acid concentrations in irrigation
water ranged from 6.6–41.1 mg SiO 2 L
−1 , with an average
value of 22.9 mg SiO 2 L
−1 (Fig. 6.8). The Iwaki River is the
main river draining the Tsugaru Plain, and tributaries flow
into this river from the surrounding mountains. Irrigation
water derived from tributaries draining the Hakkoda mountain range and Tsugaru highlands on the eastern drainage
boundary of the plain tends to have high concentrations of
silica (19.9–41.1 mg SiO 2 L
−1 ), whereas tributaries draining
the Shirakami Mountains (including the Iwaki River) on the
western drainage boundary tend to have lower silicic acid
concentrations (6.6–28.4 mg SiO 2 L
−1 ). The relationship
between the silicic acid concentration in river and irrigation
waters is represented by the regression equation,
y = 0.952x + 0.663 (r = 0.92, P < 0.01; Fig. 6.9). This
equation indicates that there is a strong relationship between
silica concentrations in river water and silica concentrations in irrigation water. From this relationship, we inferred
that the silica concentration of irrigation water could be
estimated from the silica concentrations in nearby (source)
rivers.
Fig. 6.7 Relationship between rice protein content and silica content
in maturing rice plants. Source Figure provided by Haruki Fujisawa
6 Tohoku Region
199